The Python Book
All — By Topic
2019 2016 2015 2014
angle
argsort
beautifulsoup
binary
bisect
clean
collinear
covariance
cut_paste_cli
datafaking
dataframe
datetime
day_of_week
delta_time
df2sql
doctest
exif
floodfill
fold
format
frequency
gaussian
geocode
httpserver
is
join
legend
linalg
links
matrix
max
namedtuple
null
numpy
oo
osm
packaging
pandas
plot
point
range
regex
repeat
reverse
sample_words
shortcut
shorties
sort
stemming
strip_html
stripaccent
tools
visualization
zen
zip
3d aggregation angle archive argsort atan beautifulsoup binary bisect class clean collinear colsum comprehension count covariance csv cut_paste_cli datafaking dataframe datetime day_of_week delta_time deltatime df2sql distance doctest dotproduct dropnull exif file floodfill fold format formula frequency function garmin gaussian geocode geojson gps groupby html httpserver insert ipython is join kfold legend linalg links magic matrix max min namedtuple none null numpy onehot oo osm outer_product packaging pandas plot point quickies range read_data regex repeat reverse sample sample_data sample_words shortcut shorties sort split sqlite stack stemming string strip_html stripaccent tools track tuple visualization zen zip zipfile
Binary vector
You have this vector that is a representation of a binary number. How to calculate the decimal value? Make the dot-product with the powers of two vector!
eg.
xbin=[1,1,1,1,1,0,1,0,0,0,0,0,0,0,0,0]
xdec=?
Introduction:
import numpy as np

powers_of_two = (1 << np.arange(15, -1, -1))

array([32768, 16384,  8192,  4096,  2048,  1024,   512,   256,   128,
          64,    32,    16,     8,     4,     2,     1])

seven=np.array( [0,0,0,0,0,0,0,0,0,0,0,0,0,1,1,1] )
seven.dot(powers_of_two)
7

thirtytwo=np.array( [0,0,0,0,0,0,0,0,0,0,1,0,0,0,0,0] )
thirtytwo.dot(powers_of_two)
32
Solution:
xbin=np.array([1,1,1,1,1,0,1,0,0,0,0,0,0,0,0,0])
xdec=xbin.dot(powers_of_two)
    =64000
You can also write the binary vector with T/F:
xbin=np.array([True,True,True,True,True,False,True,False,
               False,False,False,False,False,False,False,False])
xdec=xbin.dot(powers_of_two)
=64000Sample with replacement
Create a vector composed of randomly selected elements of a smaller vector. Ie. sample with replacement.
import numpy as np
src_v=np.array([1,2,3,5,8,13,21])

trg_v= src_v[np.random.randint( len(src_v), size=30)]

array([ 3,  8, 21,  5,  3,  3, 21,  5, 21,  3,  2, 13,  3, 21,  2,  2, 13,
5, 3, 21, 1, 2, 13, 3, 5, 3, 8, 8, 3, 1])Add a column of zeros to a matrix
x= np.array([ [9.,4.,7.,3.], [ 2., 0., 3., 4.], [ 1.,2.,3.,1.] ])

array([[ 9.,  4.,  7.,  3.],
       [ 2.,  0.,  3.,  4.],
       [ 1.,  2.,  3.,  1.]])
Add the column:
np.c_[ np.zeros(3), x]

array([[ 0.,  9.,  4.,  7.,  3.],
       [ 0.,  2.,  0.,  3.,  4.],
       [ 0.,  1.,  2.,  3.,  1.]])
Watchout: np.c_ takes SQUARE brackets, not parenthesis!
There is also an np.r_[ ... ] function. Maybe also have a look at vstack and hstack. See stackoverflow.com/a/8505658/4866785 for examples.
Get the indexes that would sort an array
Using numpy's argsort.
word_arr = np.array( ['lobated', 'demured', 'fristed', 'aproned', 'sheened', 'emulged',
    'bestrid', 'mourned', 'upended', 'slashed'])

idx_sorted=  np.argsort(word_arr)

idx_sorted
array([3, 6, 1, 5, 2, 0, 7, 4, 9, 8])
Let's look at the first and last three elements:
print "First three :", word_arr[ idx_sorted[:3] ]
First three : ['aproned' 'bestrid' 'demured']

print "Last three :", word_arr[ idx_sorted[-3:] ]
Last three : ['sheened' 'slashed' 'upended']
Index of min / max element
Using numpy's argmin.
Min:
In [4]: np.argmin(word_arr)
3

print word_arr[np.argmin(word_arr)]
aproned
Max:
np.argmax(word_arr)
8

print word_arr[np.argmax(word_arr)]
upendedGenerate n numbers in an interval
Return evenly spaced numbers over a specified interval.
Pre-req:
import numpy as np
import matplotlib.pyplot as plt
In linear space
y=np.linspace(0,90,num=10)
array([  0.,  10.,  20.,  30.,  40.,  50.,  60.,  70.,  80.,  90.])

x=[ i for i in range(len(y)) ]
[0, 1, 2, 3, 4, 5, 6, 7, 8, 9]

plt.plot(x,y)
plt.scatter(x,y)
plt.title("linspace")
plt.show()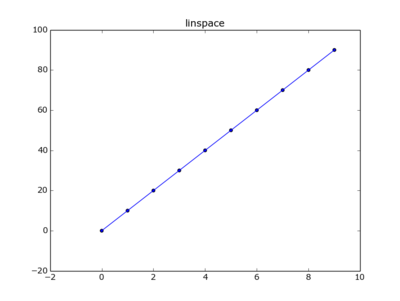
In log space
y=np.logspace(0, 9, num=10)

array([  1.00000000e+00,   1.00000000e+01,   1.00000000e+02,
         1.00000000e+03,   1.00000000e+04,   1.00000000e+05,
         1.00000000e+06,   1.00000000e+07,   1.00000000e+08,
         1.00000000e+09])

x=[ i for i in range(len(y)) ]

plt.plot(x,y)
plt.scatter(x,y)
plt.title("logspace")
plt.show()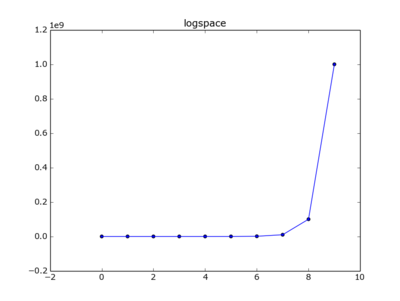
Plotting the latter on a log scale..
plt.plot(x,y)
plt.scatter(x,y)
plt.yscale('log')
plt.title("logspace on y-logscale")
plt.show()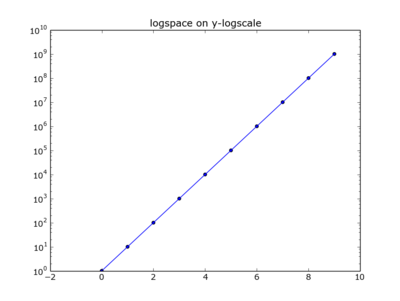
Matrix multiplication : dot product
a= np.array([[2., -1., 0.],[-3.,6.0,1.0]])

array([[ 2., -1.,  0.],
       [-3.,  6.,  1.]])


b= np.array([ [1.0,0.0,-1.0,2],[-4.,3.,1.,0.],[0.,3.,0.,-2.]])

array([[ 1.,  0., -1.,  2.],
       [-4.,  3.,  1.,  0.],
       [ 0.,  3.,  0., -2.]])

np.dot(a,b)

array([[  6.,  -3.,  -3.,   4.],
       [-27.,  21.,   9.,  -8.]])
Dot product of two vectors
Take the first row of above a matrix and the first column of above b matrix:
np.dot( np.array([ 2., -1.,  0.]), np.array([ 1.,-4.,0. ]) )
6.0
Normalize a matrix
Normalize the columns: suppose the columns make up the features, and the rows the observations.
Calculate the 'normalizers':
norms=np.linalg.norm(a,axis=0)

print norms
[ 3.60555128  6.08276253  1. ]
Turn a into normalized matrix an:
an = a/norms

print an

[[ 0.5547002  -0.16439899  0.        ]
[-0.83205029 0.98639392 1. ]]A good starting place:
matplotlib.org/mpl_toolkits/mplot3d/tutorial.html
Simple 3D scatter plot
Preliminary
from mpl_toolkits.mplot3d import axes3d
import matplotlib.pyplot as plt
import numpy as np
Data : create matrix X,Y,Z
X=[ [ i for i in range(0,10) ], ]*10
Y=np.transpose(X)

Z=[]
for i in range(len(X)):
    R=[]
    for j in range(len(Y)):
        if i==j: R.append(2)
        else: R.append(1)
    Z.append(R)
X:
[[0, 1, 2, 3, 4],
 [0, 1, 2, 3, 4],
 [0, 1, 2, 3, 4],
 [0, 1, 2, 3, 4],
 [0, 1, 2, 3, 4]]
Y:
[[0, 0, 0, 0, 0],
 [1, 1, 1, 1, 1],
 [2, 2, 2, 2, 2],
 [3, 3, 3, 3, 3],
 [4, 4, 4, 4, 4]])
Z:
[[2, 1, 1, 1, 1],
 [1, 2, 1, 1, 1],
 [1, 1, 2, 1, 1],
 [1, 1, 1, 2, 1],
 [1, 1, 1, 1, 2]]
Scatter plot
fig = plt.figure()
ax = fig.add_subplot(111, projection='3d')
ax.scatter(X, Y, Z)
plt.show()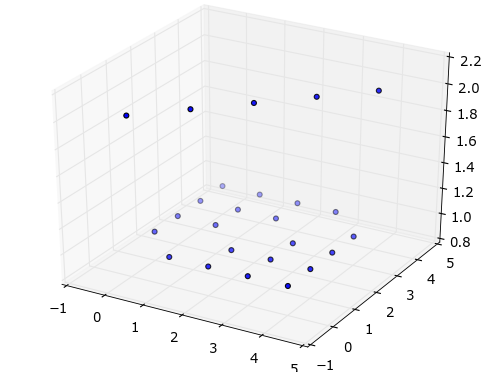
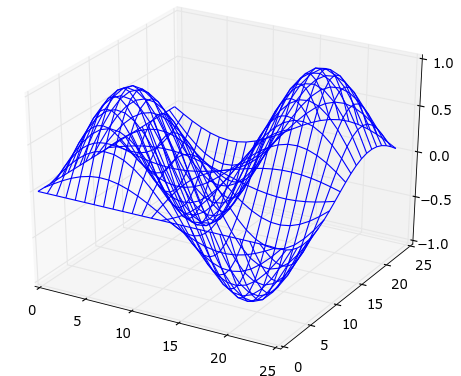
Wireframe plot
1 2 3 4 5 6 7 8 9 10 11 12 13 14 15 16 17 18 19 20 21 22 23 | |
Dot product used for aggregation of an unrolled matrix
Aggregations by column/row on an unrolled matrix, done via dot product. No need to reshape.
Column sums
Suppose this 'flat' array ..
a=np.array( [1, 2, 3, 4, 5, 6, 7, 8, 9, 10, 11, 12 ] ).. represents an 'unrolled' 3x4 matrix ..
a.reshape(3,4)

array([[ 1,  2,  3,  4],
       [ 5,  6,  7,  8],
       [ 9, 10, 11, 12]])
.. of which you want make the sums by column ..
a.reshape(3,4).sum(axis=0)
array([15, 18, 21, 24])
This can also be done by the dot product of a tiled eye with the array!
np.tile(np.eye(4),3)

array([[ 1,  0,  0,  0,  1,  0,  0,  0,  1,  0,  0,  0],
       [ 0,  1,  0,  0,  0,  1,  0,  0,  0,  1,  0,  0],
       [ 0,  0,  1,  0,  0,  0,  1,  0,  0,  0,  1,  0],
       [ 0,  0,  0,  1,  0,  0,  0,  1,  0,  0,  0,  1]])
Dot product:
np.tile(np.eye(4),3).dot(a)
array([ 15.,  18.,  21.,  24.])
Row sums
Similar story :
a.reshape(3,4)
array([[ 1,  2,  3,  4],
       [ 5,  6,  7,  8],
       [ 9, 10, 11, 12]])
Sum by row:
a.reshape(3,4).sum(axis=1)
array([10, 26, 42])
Can be expressed by a Kronecker eye-onesie :
np.kron( np.eye(3), np.ones(4) )

array([[ 1,  1,  1,  1,  0,  0,  0,  0,  0,  0,  0,  0],
       [ 0,  0,  0,  0,  1,  1,  1,  1,  0,  0,  0,  0],
       [ 0,  0,  0,  0,  0,  0,  0,  0,  1,  1,  1,  1]])
Dot product:
np.kron( np.eye(3), np.ones(4) ).dot(a)
array([ 10.,  26.,  42.])
For the np.kron() function see Kronecker product
The dot product of two matrices (Eg. a matrix and it's tranpose), equals the sum of the outer products of the row-vectors & column-vectors.
a=np.matrix( "1 2; 3 4; 5 6" )

matrix([[1, 2],
        [3, 4],
        [5, 6]])
Dot product of A and A^T :
np.dot( a, a.T)

matrix([[ 5, 11, 17],
        [11, 25, 39],
        [17, 39, 61]])
Or as the sum of the outer products of the vectors:
np.outer(a[:,0],a.T[0,:])

array([[ 1,  3,  5],
       [ 3,  9, 15],
       [ 5, 15, 25]])

np.outer(a[:,1],a.T[1,:])

array([[ 4,  8, 12],
       [ 8, 16, 24],
       [12, 24, 36]])
.. added up..
np.outer(a[:,0],a.T[0,:]) + np.outer(a[:,1],a.T[1,:])

array([[ 5, 11, 17],
       [11, 25, 39],
       [17, 39, 61]])
.. and yes it is the same as the dot product!
Note: for above, because we are forming the dot product of a matrix with its transpose, we can also write it as (not using the transpose) :
np.outer(a[:,0],a[:,0]) + np.outer(a[:,1],a[:,1])Numpy quickies
Create a matrix of 6x2 filled with random integers:
import numpy as np
ra= np.matrix( np.reshape( np.random.randint(1,10,12), (6,2) ) )

matrix([[6, 1],
        [3, 8],
        [3, 9],
        [4, 2],
        [4, 7],
[3, 9]])Dataframe with date-time index
Create a dataframe df with a datetime index and some random values: (note: see 'simpler' dataframe creation further down)
|
Output:
    In [4]: df.head(10)
    Out[4]:
                value
    2009-12-01     71
    2009-12-02     92
    2009-12-03     64
    2009-12-04     55
    2009-12-05     99
    2009-12-06     51
    2009-12-07     68
    2009-12-08     64
    2009-12-09     90
    2009-12-10     57
    [10 rows x 1 columns]
Now select a week of data
|
Output: watchout selects 8 days!!
    In [235]: df[d1:d2]
    Out[235]:
                value
    2009-12-10     99
    2009-12-11     70
    2009-12-12     83
    2009-12-13     90
    2009-12-14     60
    2009-12-15     64
    2009-12-16     59
    2009-12-17     97
    [8 rows x 1 columns]


    In [236]: df[d1:d1+dt.timedelta(days=7)]
    Out[236]:
                value
    2009-12-10     99
    2009-12-11     70
    2009-12-12     83
    2009-12-13     90
    2009-12-14     60
    2009-12-15     64
    2009-12-16     59
    2009-12-17     97
    [8 rows x 1 columns]


    In [237]: df[d1:d1+dt.timedelta(weeks=1)]
    Out[237]:
                value
    2009-12-10     99
    2009-12-11     70
    2009-12-12     83
    2009-12-13     90
    2009-12-14     60
    2009-12-15     64
    2009-12-16     59
    2009-12-17     97
    [8 rows x 1 columns]
Postscriptum: a simpler way of creating the dataframe
An index of a range of dates can also be created like this with pandas:
pd.date_range('20091201', periods=31)Hence the dataframe:
df=pd.DataFrame(np.random.randint(50,100,31), index=pd.date_range('20091201', periods=31))The magic matrices (a la octave).
23 24 25 26 27 28 29 30 31 32 33 34 35 36 37 38 39 40 41 42 43 44 45 46 47 48 49 50 51 52 53 54 55 56 57 58 | |
Sum column-wise (ie add up the elements for each column):
np.sum(magic3,axis=0)
array([15, 15, 15])
Sum row-wise (ie add up elements for each row):
np.sum(magic3,axis=1)
array([15, 15, 15])
Okay, a magic matrix is maybe not the best way to show row/column wise sums. Consider this:
rc= np.array([[0, 1, 2, 3, 4, 5],
              [0, 1, 2, 3, 4, 5],
              [0, 1, 2, 3, 4, 5]])

np.sum(rc,axis=0)           # sum over rows
[0,  3,  6,  9, 12, 15]

np.sum(rc,axis=1)           # sum over columns
[15,
 15,
 15]

np.sum(rc)                  # sum every element
45Add two dataframes
Add the contents of two dataframes, having the same index
a=pd.DataFrame( np.random.randint(1,10,5), index=['a', 'b', 'c', 'd', 'e'], columns=['val'])
b=pd.DataFrame( np.random.randint(1,10,3), index=['b', 'c', 'e'],columns=['val'])

a
   val
a    5
b    7
c    8
d    8
e    1

b
   val
b    9
c    2
e    5

a+b
   val
a  NaN
b   16
c   10
d  NaN
e    6

a.add(b,fill_value=0)
   val
a    5
b   16
c   10
d    8
e    6