The Python Book
All — By Topic
2019 2016 2015 2014
angle
argsort
beautifulsoup
binary
bisect
clean
collinear
covariance
cut_paste_cli
datafaking
dataframe
datetime
day_of_week
delta_time
df2sql
doctest
exif
floodfill
fold
format
frequency
gaussian
geocode
httpserver
is
join
legend
linalg
links
matrix
max
namedtuple
null
numpy
oo
osm
packaging
pandas
plot
point
range
regex
repeat
reverse
sample_words
shortcut
shorties
sort
stemming
strip_html
stripaccent
tools
visualization
zen
zip
3d aggregation angle archive argsort atan beautifulsoup binary bisect class clean collinear colsum comprehension count covariance csv cut_paste_cli datafaking dataframe datetime day_of_week delta_time deltatime df2sql distance doctest dotproduct dropnull exif file floodfill fold format formula frequency function garmin gaussian geocode geojson gps groupby html httpserver insert ipython is join kfold legend linalg links magic matrix max min namedtuple none null numpy onehot oo osm outer_product packaging pandas plot point quickies range read_data regex repeat reverse sample sample_data sample_words shortcut shorties sort split sqlite stack stemming string strip_html stripaccent tools track tuple visualization zen zip zipfile
Intro:
I admit that I was a huge fan of the Python setuptools library for a long time. There was a lot in there which just resonated with how I thought that software development should work. I still think that the design of setuptools is amazing. Nobody would argue that setuptools was flawless and it certainly failed in many regards. The biggest problem probably was that it was build on Python's idiotic import system but there is only so little you can do about that. In general setuptools took the realistic approach to problem-solving: do the best you can do by writing a piece of software scratches the itch without involving a committee or require language changes. That also somewhat explains the second often cited problem of setuptools: that it's a monkeypatch on distutils.
Talks about: setuptools, distutils, .pth files, PIL, eggs, ..
Digest of infoworld article
- Beautiful Soup: Processing parse trees -- XML, HTML, or similarly structured data
- Pillow: image processin g(following to PIL)
- Gooey: turn a console-based Python program into one that sports a platform-native GUI.
- Peewee: a tiny ORM that supports SQLite, MySQL, and PostgreSQL, with many extensions.
- Scrapy: screen scraping and Web crawling.
- Apache Libcloud: accessing multiple cloud providers through a single, consistent, and unified API.
- Pygame: a framework for creating video games in Python.
- Pathlib: handling filesystem paths in a consistent and cross-platform way, courtesy of a module that is now an integral part of Python.
- NumPy: scientific computing and mathematical work, including statistics, linear algebra, matrix math, financial operations, and tons more.
- Sh: calling any external program, in a subprocess, and returning the results to a Python program -- but with the same syntax as if the program in question were a native Python function.
Add records to a dataframe in a for loop
The easiest way to get csv data into a dataframe is:
pd.read_csv('in.csv')But how to do it if you need to massage the data a bit, or your input data is not comma separated ?
cols= ['entrydate','sorttag','artist','album','doi','tag' ]
df=pd.DataFrame( columns= cols )

for ..:
    data = .. a row of data-fields separated by |
              with each field still to be stripped
              of leading & trailing spaces
df.loc[len(df)]=map(str.strip,data.split('|'))Dataframe quickies
Count the number of different values in a column of a dataframe
pd.value_counts(df.Age)Drop a column
df['Unnamed: 0'].head()     # first check if it is the right one
del df['Unnamed: 0'] # drop itStrip HTML tags from a text.
6 7 8 9 10 11 12 13 14 15 16 17 18 19 20 21 22 23 24 25 26 27 28 29 30 31 32 33 34 35 36 | |
Output:
The Köln concert

[edit]

The concert was organized by 17-year-old
Vera Brandes, then Germany ’s youngest concert promoter.
[5] At Jarrett's request, Brandes
had selected a Bösendorfer
290 Imperial concert grand piano for the performance.
As found on : stackoverflow
Deduce the year from day_of_week
Suppose we know: it happened on Monday 17 November. Question: what year was it?
import datetime as dt

for i in [ dt.datetime(yr,11,17)  for yr in range(1970,2014)]:
    if i.weekday()==0: print i

1975-11-17 00:00:00
1980-11-17 00:00:00
1986-11-17 00:00:00
1997-11-17 00:00:00
2003-11-17 00:00:00
2008-11-17 00:00:00
Or suppose we want to know all mondays of November for the same year range:
for i in [ dt.datetime(yr,11,1) + dt.timedelta(days=dy)
           for yr in range(1970,2014) for dy in range(1,30)] :
    if i.weekday()==0: print i

1970-11-02 00:00:00
1970-11-09 00:00:00
1970-11-16 00:00:00
..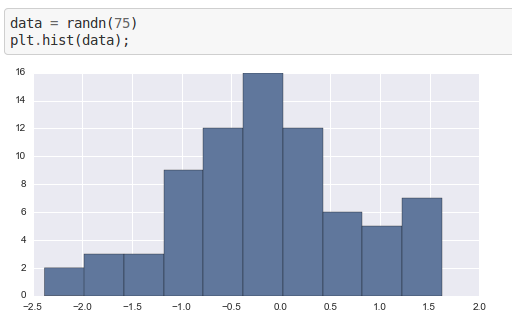
..Visualizing distributions of data
Visualizing distributions of data
This notebook demonstrates different approaches to graphically representing distributions of data, specifically focusing on the tools provided by the seaborn packageb
- stemmer that implements porter stemmer: stemming package
Quickies
You want to pandas to print more data on your wide terminal window?
pd.set_option('display.line_width', 200)You want to make the max column width larger?
pd.set_option('max_colwidth',80)Dataframe with date-time index
Create a dataframe df with a datetime index and some random values: (note: see 'simpler' dataframe creation further down)
|
Output:
    In [4]: df.head(10)
    Out[4]:
                value
    2009-12-01     71
    2009-12-02     92
    2009-12-03     64
    2009-12-04     55
    2009-12-05     99
    2009-12-06     51
    2009-12-07     68
    2009-12-08     64
    2009-12-09     90
    2009-12-10     57
    [10 rows x 1 columns]
Now select a week of data
|
Output: watchout selects 8 days!!
    In [235]: df[d1:d2]
    Out[235]:
                value
    2009-12-10     99
    2009-12-11     70
    2009-12-12     83
    2009-12-13     90
    2009-12-14     60
    2009-12-15     64
    2009-12-16     59
    2009-12-17     97
    [8 rows x 1 columns]


    In [236]: df[d1:d1+dt.timedelta(days=7)]
    Out[236]:
                value
    2009-12-10     99
    2009-12-11     70
    2009-12-12     83
    2009-12-13     90
    2009-12-14     60
    2009-12-15     64
    2009-12-16     59
    2009-12-17     97
    [8 rows x 1 columns]


    In [237]: df[d1:d1+dt.timedelta(weeks=1)]
    Out[237]:
                value
    2009-12-10     99
    2009-12-11     70
    2009-12-12     83
    2009-12-13     90
    2009-12-14     60
    2009-12-15     64
    2009-12-16     59
    2009-12-17     97
    [8 rows x 1 columns]
Postscriptum: a simpler way of creating the dataframe
An index of a range of dates can also be created like this with pandas:
pd.date_range('20091201', periods=31)Hence the dataframe:
df=pd.DataFrame(np.random.randint(50,100,31), index=pd.date_range('20091201', periods=31))The magic matrices (a la octave).
23 24 25 26 27 28 29 30 31 32 33 34 35 36 37 38 39 40 41 42 43 44 45 46 47 48 49 50 51 52 53 54 55 56 57 58 | |
Sum column-wise (ie add up the elements for each column):
np.sum(magic3,axis=0)
array([15, 15, 15])
Sum row-wise (ie add up elements for each row):
np.sum(magic3,axis=1)
array([15, 15, 15])
Okay, a magic matrix is maybe not the best way to show row/column wise sums. Consider this:
rc= np.array([[0, 1, 2, 3, 4, 5],
              [0, 1, 2, 3, 4, 5],
              [0, 1, 2, 3, 4, 5]])

np.sum(rc,axis=0)           # sum over rows
[0,  3,  6,  9, 12, 15]

np.sum(rc,axis=1)           # sum over columns
[15,
 15,
 15]

np.sum(rc)                  # sum every element
45Python documentation links
- matplotlib
Add two dataframes
Add the contents of two dataframes, having the same index
a=pd.DataFrame( np.random.randint(1,10,5), index=['a', 'b', 'c', 'd', 'e'], columns=['val'])
b=pd.DataFrame( np.random.randint(1,10,3), index=['b', 'c', 'e'],columns=['val'])

a
   val
a    5
b    7
c    8
d    8
e    1

b
   val
b    9
c    2
e    5

a+b
   val
a  NaN
b   16
c   10
d  NaN
e    6

a.add(b,fill_value=0)
   val
a    5
b   16
c   10
d    8
e 6Read/write csv
Read:
pd.read_csv('in.csv')Write:
<yourdataframe>.to_csv('out.csv',header=False, index=False ) Load a csv file
Load the following csv file. Difficulty: the date is spread over 3 fields.
    2014, 8, 5, IBM, BUY, 50,
    2014, 10, 9, IBM, SELL, 20 ,
    2014, 9, 17, PG, BUY, 10,
    2014, 8, 15, PG, SELL, 20 ,
The way I implemented it:
10 11 12 13 14 15 16 17 18 19 20 21 22 | |
An alternative way,... it's better because the date is converted on reading, and the dataframe is indexed by the date.
|