The Python Book
All — By Topic
2019 2016 2015 2014
Topics:
angle
argsort
beautifulsoup
binary
bisect
clean
collinear
covariance
cut_paste_cli
datafaking
dataframe
datetime
day_of_week
delta_time
df2sql
doctest
exif
floodfill
fold
format
frequency
gaussian
geocode
httpserver
is
join
legend
linalg
links
matrix
max
namedtuple
null
numpy
oo
osm
packaging
pandas
plot
point
range
regex
repeat
reverse
sample_words
shortcut
shorties
sort
stemming
strip_html
stripaccent
tools
visualization
zen
zip
Tags:
3d aggregation angle archive argsort atan beautifulsoup binary bisect class clean collinear colsum comprehension count covariance csv cut_paste_cli datafaking dataframe datetime day_of_week delta_time deltatime df2sql distance doctest dotproduct dropnull exif file floodfill fold format formula frequency function garmin gaussian geocode geojson gps groupby html httpserver insert ipython is join kfold legend linalg links magic matrix max min namedtuple none null numpy onehot oo osm outer_product packaging pandas plot point quickies range read_data regex repeat reverse sample sample_data sample_words shortcut shorties sort split sqlite stack stemming string strip_html stripaccent tools track tuple visualization zen zip zipfile
3d aggregation angle archive argsort atan beautifulsoup binary bisect class clean collinear colsum comprehension count covariance csv cut_paste_cli datafaking dataframe datetime day_of_week delta_time deltatime df2sql distance doctest dotproduct dropnull exif file floodfill fold format formula frequency function garmin gaussian geocode geojson gps groupby html httpserver insert ipython is join kfold legend linalg links magic matrix max min namedtuple none null numpy onehot oo osm outer_product packaging pandas plot point quickies range read_data regex repeat reverse sample sample_data sample_words shortcut shorties sort split sqlite stack stemming string strip_html stripaccent tools track tuple visualization zen zip zipfile
legend
20160201
Plot with simple legend
Use 'label' in your plot() call.
import math
import matplotlib.pyplot as plt

xv= map( lambda x: (x/4.)-10., range(0,81))

for l in [ 0.1, 0.5, 1., 5.] :
    yv= map( lambda x: math.exp((-(-x)**2)/l), xv)
    plt.plot(xv,yv,label='lambda = '+str(l));

plt.legend()
plt.show()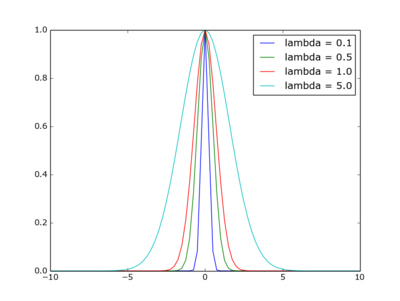
Sidenote: the function plotted is that of the Gaussian kernel in weighted nearest neighour regression, with xi=0