The Python Book
All — By Topic
2019 2016 2015 2014
angle
argsort
beautifulsoup
binary
bisect
clean
collinear
covariance
cut_paste_cli
datafaking
dataframe
datetime
day_of_week
delta_time
df2sql
doctest
exif
floodfill
fold
format
frequency
gaussian
geocode
httpserver
is
join
legend
linalg
links
matrix
max
namedtuple
null
numpy
oo
osm
packaging
pandas
plot
point
range
regex
repeat
reverse
sample_words
shortcut
shorties
sort
stemming
strip_html
stripaccent
tools
visualization
zen
zip
3d aggregation angle archive argsort atan beautifulsoup binary bisect class clean collinear colsum comprehension count covariance csv cut_paste_cli datafaking dataframe datetime day_of_week delta_time deltatime df2sql distance doctest dotproduct dropnull exif file floodfill fold format formula frequency function garmin gaussian geocode geojson gps groupby html httpserver insert ipython is join kfold legend linalg links magic matrix max min namedtuple none null numpy onehot oo osm outer_product packaging pandas plot point quickies range read_data regex repeat reverse sample sample_data sample_words shortcut shorties sort split sqlite stack stemming string strip_html stripaccent tools track tuple visualization zen zip zipfile
Angle between 2 points
Calculate the angle in radians, between the horizontal through the 1st point and a line through the two points
def angle(p0,p1):
    dx=float(p1.x)-float(p0.x)
    dy=float(p1.y)-float(p0.y)
    if dx==0:
        if dy==0:
            return 0.0
        elif dy<0:
            return math.atan(float('-inf'))
        else:
            return math.atan(float('inf'))
return math.atan(dy/dx)Get the indexes that would sort an array
Using numpy's argsort.
word_arr = np.array( ['lobated', 'demured', 'fristed', 'aproned', 'sheened', 'emulged',
    'bestrid', 'mourned', 'upended', 'slashed'])

idx_sorted=  np.argsort(word_arr)

idx_sorted
array([3, 6, 1, 5, 2, 0, 7, 4, 9, 8])
Let's look at the first and last three elements:
print "First three :", word_arr[ idx_sorted[:3] ]
First three : ['aproned' 'bestrid' 'demured']

print "Last three :", word_arr[ idx_sorted[-3:] ]
Last three : ['sheened' 'slashed' 'upended']
Index of min / max element
Using numpy's argmin.
Min:
In [4]: np.argmin(word_arr)
3

print word_arr[np.argmin(word_arr)]
aproned
Max:
np.argmax(word_arr)
8

print word_arr[np.argmax(word_arr)]
upendedThe topics of the kubercon (Kubernetes conference)
Input
Markdown doc 'source.md' with all the presentation titles plus links:
[2000 Nodes and Beyond: How We Scaled Kubernetes to 60,000-Container Clusters
and Where We're Going Next - Marek Grabowski, Google Willow
A](/event/8K8w/2000-nodes-and-beyond-how-we-scaled-kubernetes-to-60000
-container-clusters-and-where-were-going-next-marek-grabowski-google) [How Box
Runs Containers in Production with Kubernetes - Sam Ghods, Box Grand Ballroom
D](/event/8K8u/how-box-runs-containers-in-production-with-kubernetes-sam-
ghods-box) [ITNW (If This Now What) - Orchestrating an Enterprise - Michael
Ward, Pearson Grand Ballroom C](/event/8K8t/itnw-if-this-now-what-
orchestrating-an-enterprise-michael-ward-pearson) [Unik: Unikernel Runtime for
Kubernetes - Idit Levine, EMC Redwood AB](/event/8K8v/unik-unikernel-runtime-
..
..
Step 1: generate download script
Grab the links from 'source.md' and download them.
#!/usr/bin/python
# -*- coding: utf-8 -*-

import re

buf=""
infile = file('source.md', 'r')
for line in infile.readlines():
    buf+=line.rstrip('\n')

oo=1
while True:
    match = re.search( '^(.*?\()(/.[^\)]*)(\).*$)', buf)
    if match is None:
        break
    url="https://cnkc16.sched.org"+match.group(2)
    print "wget '{}' -O {:0>4d}.html".format(url,oo)
    oo+=1
    buf=match.group(3)
Step 2: download the html
Execute the script generated by above code, and put the resulting files in directory 'content' :
wget 'https://cnkc16.sched.org/event/8K8w/2000-nodes-and-beyond-how-
      we-scaled-kubernetes-to-60000-container-clusters-and-where-were-
      going-next-marek-grabowski-google' -O 0001.html
wget 'https://cnkc16.sched.org/event/8K8u/how-box-runs-containers-in-
      production-with-kubernetes-sam-ghods-box' -O 0002.html
wget 'https://cnkc16.sched.org/event/8K8t/itnw-if-this-now-what-
      orchestrating-an-enterprise-michael-ward-pearson' -O 0003.html
..
Step 3: parse with beautiful soup
#!/usr/bin/python
# -*- coding: utf-8 -*-

from BeautifulSoup import *
import os
import re
import codecs

#outfile = file('text.md', 'w')
# ^^^ --> UnicodeEncodeError:
#                'ascii' codec can't encode character u'\u2019'
#                in position 73: ordinal not in range(128)
outfile= codecs.open("text.md", "w", "utf-8")

file_ls=[]
for filename in os.listdir("content"):
    if filename.endswith(".html"):
        file_ls.append(filename)

for filename in sorted(file_ls):
    infile = file('content/'+filename,'r')
    content = infile.read()
    infile.close()
    soup = BeautifulSoup(content.decode('utf-8','ignore'))

    div= soup.find('div', attrs={'class':'sched-container-inner'})
    el_ls= div.findAll('span')

    el=el_ls[0].text.strip()
    title=re.sub(' - .*$','',el)
    speaker=re.sub('^.* - ','',el)

    outfile.write( u'\n\n## {}\n'.format(title))
    outfile.write( u'\n\n{}\n'.format(speaker) )

    det= div.find('div', attrs={'class':'tip-description'})
    if det is not None:
outfile.write( u'\n{}\n'.format(det.text.strip() ) )Create a DB by scraping a webpage
Download all the webpages and put them in a zipfile (to avoid 're-downloading' on each try).
If you want to work 'direct', then use this to read the html content of a url:
html_doc=urllib.urlopen(url).read()Preparation: create database table
cur.execute('DROP TABLE IF EXISTS t_result')

cur.execute('''
CREATE TABLE t_result(
        pos  varchar(128),
        nr  varchar(128),
        gesl varchar(128),
        naam varchar(128),
        leeftijd varchar(128),
        ioc varchar(128),
        tijd varchar(128),
        tkm varchar(128),
        gem varchar(128),
        cat_plaats varchar(128),
        cat_naam varchar(128),
        gemeente varchar(128)
        )
''') ##
Pull each html file from the zipfile
zf=zipfile.ZipFile('brx_marathon_html.zip','r')
for fn in zf.namelist():
    try:
        content= zf.read(fn)
        handle_content(content)
    except KeyError:
        print 'ERROR: %s not in zip file' % fn
        break
Parse the content of each html file with Beautiful Soup
soup = BeautifulSoup(content)

table= soup.find('table', attrs={'cellspacing':'0', 'cellpadding':'2'})
rows = table.findAll('tr')
for row in rows:
    cols = row.findAll('td')
    e = [ ele.text.strip()  for ele in cols]
    if len(e)>10:
        cur.execute('INSERT INTO T_RESULT VALUES ( ?, ?, ?, ?, ?, ?, ?, ?, ?, ?, ?,? )',
                    (e[0],e[1],e[2],e[3],e[4],e[5],e[6],e[7],e[8],e[9],e[10],e[11]) )
Note: the above code is beautiful soup 3, for beautiful soup 4, the findAll needs to be replaced by find_all.
Complete source code
1 2 3 4 5 6 7 8 9 10 11 12 13 14 15 16 17 18 19 20 21 22 23 24 25 26 27 28 29 30 31 32 33 34 35 36 37 38 39 40 41 42 43 44 45 46 47 48 49 50 51 52 53 54 55 56 57 58 59 | |
Binary vector
You have this vector that is a representation of a binary number. How to calculate the decimal value? Make the dot-product with the powers of two vector!
eg.
xbin=[1,1,1,1,1,0,1,0,0,0,0,0,0,0,0,0]
xdec=?
Introduction:
import numpy as np

powers_of_two = (1 << np.arange(15, -1, -1))

array([32768, 16384,  8192,  4096,  2048,  1024,   512,   256,   128,
          64,    32,    16,     8,     4,     2,     1])

seven=np.array( [0,0,0,0,0,0,0,0,0,0,0,0,0,1,1,1] )
seven.dot(powers_of_two)
7

thirtytwo=np.array( [0,0,0,0,0,0,0,0,0,0,1,0,0,0,0,0] )
thirtytwo.dot(powers_of_two)
32
Solution:
xbin=np.array([1,1,1,1,1,0,1,0,0,0,0,0,0,0,0,0])
xdec=xbin.dot(powers_of_two)
    =64000
You can also write the binary vector with T/F:
xbin=np.array([True,True,True,True,True,False,True,False,
               False,False,False,False,False,False,False,False])
xdec=xbin.dot(powers_of_two)
=64000Insert an element into an array, keeping the array ordered
Using the bisect_left() function of module bisect, which locates the insertion point.
def insert_ordered(ar, val):
    i=0
    if len(ar)>0:
        i=bisect.bisect_left(ar,val)
    ar.insert(i,val)
Usage:
ar=[]
insert_ordered( ar, 10 )
insert_ordered( ar, 20 )
insert_ordered( ar, 5 )Retain recent files
eg. an application produces a backup file every night. You only want to keep the last 5 files.
Pipe the output of the following script (retain_recent.py) into a sh, eg in a cronjob:
/YOURPATH/retain_recent.py | bash Python code that produces 'rm fileX' statements:
#list the files according to a pattern, except for the N most recent files
import os,sys,time

fnList=[]

d='/../confluence_data/backups/'
for f in os.listdir( d ):
    (mode, ino, dev, nlink, uid, gid, size, atime, mtime, ctime) = os.stat(d+"/"+f)
    s='%s|%s/%s|%s' % ( mtime, d, f, time.ctime(mtime))
    #print s
    fnList.append(s)

# retain the 5 most recent files:
nd=len(fnList)-5

c=0
for s in sorted(fnList):
    (mt,fn,hd)=s.split('|')
    c+=1
    if (c>=nd):
        print '#keeping %s (%s)' % ( fn, hd )
    else:
print 'rm -v %s #deleting (%s)' % ( fn, hd )Generate an array of collinear points plus some random points
- generate a number of points (integers) that are on the same line
- randomly intersperse these coordinates with a set of random points
- watchout: may generate dupes! (the random points, not the collinear points)
Source:
import random

p=[(5,5),(1,10)]    # points that define the line

# warning: this won't work for vertical line!!!
slope= (float(p[1][1])-float(p[0][1]))/(float(p[1][0])-float(p[0][0]) )
intercept= float(p[0][1])-slope*float(p[0][0])

ar=[]
for x in range(0,25):
    y=slope*float(x)+intercept

    # only keep the y's that are integers
    if (y%2)==0:
        ar.append((x,int(y)))

    # intersperse with random coordinates
    r=3+random.randrange(0,5)

    # only add random points when random nr is even
    if r%2==0:
        ar.extend( [ (random.randrange(0,100),random.randrange(0,100)) for j in range(r) ])

print ar
Sample output:
[(1, 10), (97, 46), (94, 12), (33, 10), (9, 71), (9, 0), (28, 34),
(2, 94), (30, 29), (69, 28), (82, 31), (79, 86), (88, 46), (59, 24),
(2, 78), (54, 88), (94, 78), (99, 37), (75, 48), (91, 1), (67, 61),
(12, 11), (55, 55), (58, 82), (95, 99), (56, 27), (12, 18), (99, 25),
(77, 84), (31, 39), (64, 84), (4, 13), (80, 63), (43, 27), (78, 43),
(24, 32), (17, -10), (73, 15), (6, 97), (0, 74), (16, 97), (6, 77),
(60, 77), (19, 83), (19, 82), (19, 40), (58, 63), (64, 62), (14, 53),
(57, 21), (49, 24), (66, 94), (82, 1), (29, 39), (55, 64), (85, 68),
(39, 24)]np.random.multivariate_normal()
import numpy as np
import matplotlib.pyplot as plt

means = [
    [9, 9], # top right
    [1, 9], # top left
    [1, 1], # bottom left
    [9, 1], # bottom right
]


covariances = [
    [ [.5, 0.],    # covariance top right
      [0, .5] ],
    [[.1, .0],   # covariance top left
     [.0, .9]],
    [[.9, 0.],     # covariance bottom left
     [0, .1]],
    [[0.5, 0.5],     # covariance bottom right
     [0.5, 0.5]] ]


data = []
for k in range(len(means)):
  for i in range(100) :
    x = np.random.multivariate_normal(means[k], covariances[k])
    data.append(x)

d=np.vstack(data)
plt.plot(d[:,0], d[:,1],'ko')
plt.show()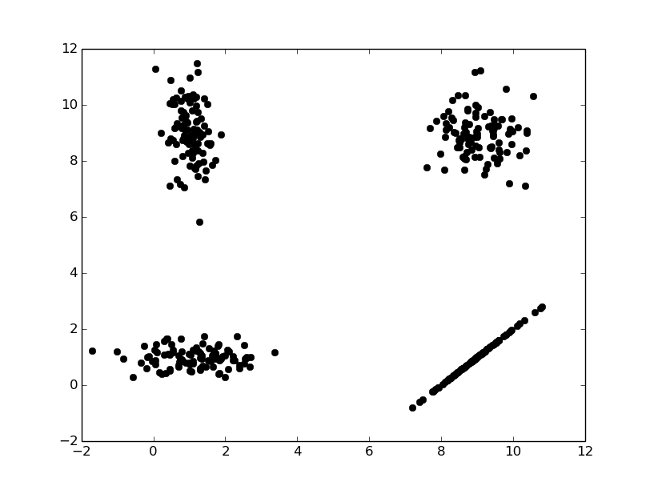
Cut and paste python on the command line
Simple example: number the lines in a text file
Read the file 'message.txt' and print a linenumber plus the line content.
python - message.txt <<EOF
import sys
i=1
with open(sys.argv[1],"r") as f:
  for l in f.readlines():
    print i,l.strip('\n')
    i+=1
EOF
Output:
1 Better shutdown your ftp service.
2
3 W.
Create a python program that reads a csv file, and uses the named fields
TBD.
Use namedtuple
Also see districtdatalabs.silvrback.com/simple-csv-data-wrangling-with-python
Anonymizing Data
Read this article on faker:
blog.districtdatalabs.com/a-practical-guide-to-anonymizing-datasets-with-python-faker
The goal: given a target dataset (for example, a CSV file with multiple columns), produce a new dataset such that for each row in the target, the anonymized dataset does not contain any personally identifying information. The anonymized dataset should have the same amount of data and maintain its analytical value. As shown in the figure below, one possible transformation simply maps original information to fake and therefore anonymous information but maintains the same overall structure.
Turn a dataframe into an array
eg. dataframe cn
cn

                     asciiname  population  elevation
128677                Crossett        5507         58
7990    Santa Maria da Vitoria       23488        438
25484                 Shanling           0        628
95882     Colonia Santa Teresa       36845       2286
38943                 Blomberg        1498          4
7409              Missao Velha       13106        364
36937                  Goerzig        1295         81
Turn into an arrary
cn.iloc[range(len(cn))].values


array([['Yuhu', 0, 15],
       ['Traventhal', 551, 42],
       ['Velabisht', 0, 60],
       ['Almorox', 2319, 539],
       ['Abuyog', 15632, 6],
       ['Zhangshan', 0, 132],
       ['Llica de Vall', 0, 136],
       ['Capellania', 2252, 31],
       ['Mezocsat', 6519, 91],
       ['Vars', 1634, 52]], dtype=object)
Sidenote: cn was pulled from city data: cn=df.sample(7)[['asciiname','population','elevation']].
Filter a dataframe to retain rows with non-null values
Eg. you want only the data where the 'population' column has non-null values.
In short
df=df[df['population'].notnull()]Alternative, replace the null value with something:
df['population']=df['population'].fillna(0) In detail
import numpy as np
import pandas as pd

# setup the dataframe
data=[[ 'Isle of Skye',         9232, 124 ],
      [ 'Vieux-Charmont',     np.nan, 320 ],
      [ 'Indian Head',          3844,  35 ],
      [ 'Cihua',              np.nan, 178 ],
      [ 'Miasteczko Slaskie',   7327, 301 ],
      [ 'Wawa',               np.nan,   7 ],
      [ 'Bat Khela',           46079, 673 ]]

df=pd.DataFrame(data, columns=['asciiname','population','elevation'])

#display the dataframe
df

            asciiname  population  elevation
0        Isle of Skye      9232.0        124
1      Vieux-Charmont         NaN        320
2         Indian Head      3844.0         35
3               Cihua         NaN        178
4  Miasteczko Slaskie      7327.0        301
5                Wawa         NaN          7


# retain only the rows where population has a non-null value
df=df[df['population'].notnull()]

            asciiname  population  elevation
0        Isle of Skye      9232.0        124
2         Indian Head      3844.0         35
4  Miasteczko Slaskie      7327.0        301
6 Bat Khela 46079.0 673Add records to a dataframe in a for loop
The easiest way to get csv data into a dataframe is:
pd.read_csv('in.csv')But how to do it if you need to massage the data a bit, or your input data is not comma separated ?
cols= ['entrydate','sorttag','artist','album','doi','tag' ]
df=pd.DataFrame( columns= cols )

for ..:
    data = .. a row of data-fields separated by |
              with each field still to be stripped
              of leading & trailing spaces
df.loc[len(df)]=map(str.strip,data.split('|'))Dataframe quickies
Count the number of different values in a column of a dataframe
pd.value_counts(df.Age)Drop a column
df['Unnamed: 0'].head()     # first check if it is the right one
del df['Unnamed: 0'] # drop itDays between dates
Q: how many days are there in between these days ?
'29 sep 2016', '7 jul 2016', '28 apr 2016', '10 mar 2016', '14 jan 2016'Solution:
from datetime import datetime,timedelta

a=map(lambda x: datetime.strptime(x,'%d %b %Y'),
      ['29 sep 2016', '7 jul 2016', '28 apr 2016', '10 mar 2016', '14 jan 2016'] )

def dr(ar):
    if len(ar)>1:
        print "{:%d %b %Y} .. {} .. {:%d %b %Y} ".format(
                            ar[0], (ar[0]-ar[1]).days, ar[1])
        dr(ar[1:])
Output:
dr(a)

29 Sep 2016 .. 84 .. 07 Jul 2016
07 Jul 2016 .. 70 .. 28 Apr 2016
28 Apr 2016 .. 49 .. 10 Mar 2016
10 Mar 2016 .. 56 .. 14 Jan 2016 Dataframe with date-time index
Create a dataframe df with a datetime index and some random values: (note: see 'simpler' dataframe creation further down)
|
Output:
    In [4]: df.head(10)
    Out[4]:
                value
    2009-12-01     71
    2009-12-02     92
    2009-12-03     64
    2009-12-04     55
    2009-12-05     99
    2009-12-06     51
    2009-12-07     68
    2009-12-08     64
    2009-12-09     90
    2009-12-10     57
    [10 rows x 1 columns]
Now select a week of data
|
Output: watchout selects 8 days!!
    In [235]: df[d1:d2]
    Out[235]:
                value
    2009-12-10     99
    2009-12-11     70
    2009-12-12     83
    2009-12-13     90
    2009-12-14     60
    2009-12-15     64
    2009-12-16     59
    2009-12-17     97
    [8 rows x 1 columns]


    In [236]: df[d1:d1+dt.timedelta(days=7)]
    Out[236]:
                value
    2009-12-10     99
    2009-12-11     70
    2009-12-12     83
    2009-12-13     90
    2009-12-14     60
    2009-12-15     64
    2009-12-16     59
    2009-12-17     97
    [8 rows x 1 columns]


    In [237]: df[d1:d1+dt.timedelta(weeks=1)]
    Out[237]:
                value
    2009-12-10     99
    2009-12-11     70
    2009-12-12     83
    2009-12-13     90
    2009-12-14     60
    2009-12-15     64
    2009-12-16     59
    2009-12-17     97
    [8 rows x 1 columns]
Postscriptum: a simpler way of creating the dataframe
An index of a range of dates can also be created like this with pandas:
pd.date_range('20091201', periods=31)Hence the dataframe:
df=pd.DataFrame(np.random.randint(50,100,31), index=pd.date_range('20091201', periods=31))Deduce the year from day_of_week
Suppose we know: it happened on Monday 17 November. Question: what year was it?
import datetime as dt

for i in [ dt.datetime(yr,11,17)  for yr in range(1970,2014)]:
    if i.weekday()==0: print i

1975-11-17 00:00:00
1980-11-17 00:00:00
1986-11-17 00:00:00
1997-11-17 00:00:00
2003-11-17 00:00:00
2008-11-17 00:00:00
Or suppose we want to know all mondays of November for the same year range:
for i in [ dt.datetime(yr,11,1) + dt.timedelta(days=dy)
           for yr in range(1970,2014) for dy in range(1,30)] :
    if i.weekday()==0: print i

1970-11-02 00:00:00
1970-11-09 00:00:00
1970-11-16 00:00:00
..
..Add/subtract a delta time
Problem
A number of photo files were tagged as follows, with the date and the time:
20151205_17h48-img_0098.jpg
20151205_18h20-img_0099.jpg
20151205_18h21-img_0100.jpg
..
Turns out that they should be all an hour earlier (reminder: mixing pics from two camera's), so let's create a script to rename these files...
Solution
1. Start
Let's use pandas:
import datetime as dt
import pandas as pd
import re

df0=pd.io.parsers.read_table( '/u01/work/20151205_gran_canaria/fl.txt',sep=",", \
        header=None, names= ["fn"])
df=df0[df0['fn'].apply( lambda a: 'img_0' in a )]  # filter out certain pics
2. Make parseable
Now add a column to the dataframe that only contains the numbers of the date, so it can be parsed:
df['rawdt']=df['fn'].apply( lambda a: re.sub('-.*.jpg','',a))\
                 .apply( lambda a: re.sub('[_h]','',a))
Result:
df.head()
                             fn         rawdt
0   20151202_07h17-img_0001.jpg  201512020717
1   20151202_07h17-img_0002.jpg  201512020717
2   20151202_07h17-img_0003.jpg  201512020717
3   20151202_15h29-img_0004.jpg  201512021529
28  20151202_17h59-img_0005.jpg  201512021759
3. Convert to datetime, and subtract delta time
Convert the raw-date to a real date, and subtract an hour:
df['adjdt']=pd.to_datetime( df['rawdt'], format('%Y%m%d%H%M'))-dt.timedelta(hours=1)Note 20190105: apparently you can drop the 'format' string:
df['adjdt']=pd.to_datetime( df['rawdt'])-dt.timedelta(hours=1) Result:
                             fn         rawdt               adjdt
0   20151202_07h17-img_0001.jpg  201512020717 2015-12-02 06:17:00
1   20151202_07h17-img_0002.jpg  201512020717 2015-12-02 06:17:00
2   20151202_07h17-img_0003.jpg  201512020717 2015-12-02 06:17:00
3   20151202_15h29-img_0004.jpg  201512021529 2015-12-02 14:29:00
28  20151202_17h59-img_0005.jpg  201512021759 2015-12-02 16:59:00
4. Convert adjusted date to string
df['adj']=df['adjdt'].apply(lambda a: dt.datetime.strftime(a, "%Y%m%d_%Hh%M") )We also need the 'stem' of the filename:
df['stem']=df['fn'].apply(lambda a: re.sub('^.*-','',a) )Result:
df.head()
                             fn         rawdt               adjdt  \
0   20151202_07h17-img_0001.jpg  201512020717 2015-12-02 06:17:00
1   20151202_07h17-img_0002.jpg  201512020717 2015-12-02 06:17:00
2   20151202_07h17-img_0003.jpg  201512020717 2015-12-02 06:17:00
3   20151202_15h29-img_0004.jpg  201512021529 2015-12-02 14:29:00
28  20151202_17h59-img_0005.jpg  201512021759 2015-12-02 16:59:00

               adj          stem
0   20151202_06h17  img_0001.jpg
1   20151202_06h17  img_0002.jpg
2   20151202_06h17  img_0003.jpg
3   20151202_14h29  img_0004.jpg
28  20151202_16h59  img_0005.jpg
5. Cleanup
Drop columns that are no longer useful:
df=df.drop(['rawdt','adjdt'], axis=1)Result:
df.head()
                             fn             adj          stem
0   20151202_07h17-img_0001.jpg  20151202_06h17  img_0001.jpg
1   20151202_07h17-img_0002.jpg  20151202_06h17  img_0002.jpg
2   20151202_07h17-img_0003.jpg  20151202_06h17  img_0003.jpg
3   20151202_15h29-img_0004.jpg  20151202_14h29  img_0004.jpg
28  20151202_17h59-img_0005.jpg  20151202_16h59  img_0005.jpg
6. Generate scripts
Generate the 'rename' script:
sh=df.apply( lambda a: 'mv {} {}-{}'.format( a[0],a[1],a[2]), axis=1)
sh.to_csv('rename.sh',header=False, index=False )
Also generate the 'rollback' script (in case we have to rollback the renaming) :
sh=df.apply( lambda a: 'mv {}-{} {}'.format( a[1],a[2],a[0]), axis=1)
sh.to_csv('rollback.sh',header=False, index=False )
First lines of the rename script:
mv 20151202_07h17-img_0001.jpg 20151202_06h17-img_0001.jpg
mv 20151202_07h17-img_0002.jpg 20151202_06h17-img_0002.jpg
mv 20151202_07h17-img_0003.jpg 20151202_06h17-img_0003.jpg
mv 20151202_15h29-img_0004.jpg 20151202_14h29-img_0004.jpg
mv 20151202_17h59-img_0005.jpg 20151202_16h59-img_0005.jpgTurn a dataframe into sql statements
The easiest way is to go via sqlite!
eg. the two dataframes udf and tdf.
import sqlite3
con=sqlite3.connect('txdb.sqlite')
udf.to_sql(name='t_user', con=con, index=False)
tdf.to_sql(name='t_transaction', con=con, index=False)
con.close()
Then on the command line:
sqlite3 txdb.sqlite .dump > create.sql This is the created create.sql script:
PRAGMA foreign_keys=OFF;
BEGIN TRANSACTION;

CREATE TABLE "t_user" (
"uid" INTEGER,
  "name" TEXT
);
INSERT INTO "t_user" VALUES(9000,'Gerd Abrahamsson');
INSERT INTO "t_user" VALUES(9001,'Hanna Andersson');
INSERT INTO "t_user" VALUES(9002,'August Bergsten');
INSERT INTO "t_user" VALUES(9003,'Arvid Bohlin');
INSERT INTO "t_user" VALUES(9004,'Edvard Marklund');
INSERT INTO "t_user" VALUES(9005,'Ragnhild Brännström');
INSERT INTO "t_user" VALUES(9006,'Börje Wallin');
INSERT INTO "t_user" VALUES(9007,'Otto Byström');
INSERT INTO "t_user" VALUES(9008,'Elise Dahlström');

CREATE TABLE "t_transaction" (
"xid" INTEGER,
  "uid" INTEGER,
  "amount" INTEGER,
  "date" TEXT
);
INSERT INTO "t_transaction" VALUES(5000,9008,498,'2016-02-21 06:28:49');
INSERT INTO "t_transaction" VALUES(5001,9003,268,'2016-01-17 13:37:38');
INSERT INTO "t_transaction" VALUES(5002,9003,621,'2016-02-24 15:36:53');
INSERT INTO "t_transaction" VALUES(5003,9007,-401,'2016-01-14 16:43:27');
INSERT INTO "t_transaction" VALUES(5004,9004,720,'2016-05-14 16:29:54');
INSERT INTO "t_transaction" VALUES(5005,9007,-492,'2016-02-24 23:58:57');
INSERT INTO "t_transaction" VALUES(5006,9002,-153,'2016-02-18 17:58:33');
INSERT INTO "t_transaction" VALUES(5007,9008,272,'2016-05-26 12:00:00');
INSERT INTO "t_transaction" VALUES(5008,9005,-250,'2016-02-24 23:14:52');
INSERT INTO "t_transaction" VALUES(5009,9008,82,'2016-04-20 18:33:25');
INSERT INTO "t_transaction" VALUES(5010,9006,549,'2016-02-16 14:37:25');
INSERT INTO "t_transaction" VALUES(5011,9008,-571,'2016-02-28 13:05:33');
INSERT INTO "t_transaction" VALUES(5012,9008,814,'2016-03-20 13:29:11');
INSERT INTO "t_transaction" VALUES(5013,9005,-114,'2016-02-06 14:55:10');
INSERT INTO "t_transaction" VALUES(5014,9005,819,'2016-01-18 10:50:20');
INSERT INTO "t_transaction" VALUES(5015,9001,-404,'2016-02-20 22:08:23');
INSERT INTO "t_transaction" VALUES(5016,9000,-95,'2016-05-09 10:26:05');
INSERT INTO "t_transaction" VALUES(5017,9003,428,'2016-03-27 15:30:47');
INSERT INTO "t_transaction" VALUES(5018,9002,-549,'2016-04-15 21:44:49');
INSERT INTO "t_transaction" VALUES(5019,9001,-462,'2016-03-09 20:32:35');
INSERT INTO "t_transaction" VALUES(5020,9004,-339,'2016-05-03 17:11:21');
COMMIT;
The script doesn't create the indexes (because of Index='False'), so here are the statements:
CREATE INDEX "ix_t_user_uid" ON "t_user" ("uid");
CREATE INDEX "ix_t_transaction_xid" ON "t_transaction" ("xid");
Or better: create primary keys on those tables!
Run a doctest on your python src file
.. first include unit tests in your docstrings:
eg. the file 'mydoctest.py'
#!/usr/bin/python3

def fact(n):
    '''
    Factorial.
    >>> fact(6)
    720
    >>> fact(7)
    5040
    '''
    return n*fact(n-1) if n>1 else n
Run the doctests:
python3 -m doctest mydoctest.pyOr from within python:
>>> import doctest
>>> doctest.testfile("mydoctest.py")
(hmm, doesn't work the way it should... import missing?)
List EXIF details of a photo
This program walks a directory, and lists selected exif data.
Install module exifread first.
1 2 3 4 5 6 7 8 9 10 11 12 13 14 15 16 17 18 19 20 21 22 23 24 25 26 | |
Flood fill
- Turn lines of text into a grid[row][column] (taking care to pad the lines to get a proper rectangle)
- Central data structure for the flood-fill is a stack
- If the randomly chosen point is blank, then fill it, and push the coordinates of its 4 neighbours onto the stack
- Handle the neighbouring points the same way
Src:
#!/usr/bin/python

import random

lines='''
+++++++        ++++++++++                ++++++++++++++++++++    +++++
+     +        +        +                +                  +    +   +
+     +        +        +                +                  +    +++++
+     +        +     ++++                +                  +
+++++++        +                         +                  +
               +     ++++                +                  +
               +        +                +                  +
               +        +                +                  +
               +        +                +                  +
               ++++++++++                +                  +
                                         +                  +
                                         +                  +
     ++++++++++++                        +                  +
     +          +                        +                  +
     +          +                         +                +
     +          +                          +              +
     ++++++++++++                           ++++++++++++++
'''.split("\n")


# maximum number of columns and rows
colmax= max( [ len(line) for line in lines ] )
rowmax=len(lines)

padding=' ' * colmax
grid= [ list(lines[row]+padding)[0:colmax]  for row in range(0,rowmax) ]

for l in grid: print( ''.join(l) )   # print the grid
print '-' * colmax                   # print a separating line

# creat a stack, and put a random coordinate on it
pointstack=[]
pointstack.append( ( random.randint(0,colmax),      # col
                     random.randint(0,rowmax) ) )   # row

# floodfill
while len(pointstack)>0:
    (col,row)=pointstack.pop()
    if col>=0 and col<colmax and row>=0 and row<rowmax:
        if grid[row][col]==' ':
            grid[row][col]='O'
            if col<(colmax-1): pointstack.append( (col+1,row))
            if col>0:          pointstack.append( (col-1,row))
            if row<(rowmax-1): pointstack.append( (col,row+1) )
            if row>0:          pointstack.append( (col,row-1) )

for l in grid: print( ''.join(l) ) # print the grid
Output of a few runs:
+++++++        ++++++++++                ++++++++++++++++++++    +++++
+     +        +        +                +OOOOOOOOOOOOOOOOOO+    +   +
+     +        +        +                +OOOOOOOOOOOOOOOOOO+    +++++
+     +        +     ++++                +OOOOOOOOOOOOOOOOOO+
+++++++        +                         +OOOOOOOOOOOOOOOOOO+
               +     ++++                +OOOOOOOOOOOOOOOOOO+
               +        +                +OOOOOOOOOOOOOOOOOO+
               +        +                +OOOOOOOOOOOOOOOOOO+
               +        +                +OOOOOOOOOOOOOOOOOO+
               ++++++++++                +OOOOOOOOOOOOOOOOOO+
                                         +OOOOOOOOOOOOOOOOOO+
                                         +OOOOOOOOOOOOOOOOOO+
     ++++++++++++                        +OOOOOOOOOOOOOOOOOO+
     +          +                        +OOOOOOOOOOOOOOOOOO+
     +          +                         +OOOOOOOOOOOOOOOO+
     +          +                          +OOOOOOOOOOOOOO+
     ++++++++++++                           ++++++++++++++
Completely flooded:
OOOOOOOOOOOOOOOOOOOOOOOOOOOOOOOOOOOOOOOOOOOOOOOOOOOOOOOOOOOOOOOOOOOOOOOOO
+++++++OOOOOOOO++++++++++OOOOOOOOOOOOOOOO++++++++++++++++++++OOOO+++++OOO
+     +OOOOOOOO+OOOOOOOO+OOOOOOOOOOOOOOOO+                  +OOOO+   +OOO
+     +OOOOOOOO+OOOOOOOO+OOOOOOOOOOOOOOOO+                  +OOOO+++++OOO
+     +OOOOOOOO+OOOOO++++OOOOOOOOOOOOOOOO+                  +OOOOOOOOOOOO
+++++++OOOOOOOO+OOOOOOOOOOOOOOOOOOOOOOOOO+                  +OOOOOOOOOOOO
OOOOOOOOOOOOOOO+OOOOO++++OOOOOOOOOOOOOOOO+                  +OOOOOOOOOOOO
OOOOOOOOOOOOOOO+OOOOOOOO+OOOOOOOOOOOOOOOO+                  +OOOOOOOOOOOO
OOOOOOOOOOOOOOO+OOOOOOOO+OOOOOOOOOOOOOOOO+                  +OOOOOOOOOOOO
OOOOOOOOOOOOOOO+OOOOOOOO+OOOOOOOOOOOOOOOO+                  +OOOOOOOOOOOO
OOOOOOOOOOOOOOO++++++++++OOOOOOOOOOOOOOOO+                  +OOOOOOOOOOOO
OOOOOOOOOOOOOOOOOOOOOOOOOOOOOOOOOOOOOOOOO+                  +OOOOOOOOOOOO
OOOOOOOOOOOOOOOOOOOOOOOOOOOOOOOOOOOOOOOOO+                  +OOOOOOOOOOOO
OOOOO++++++++++++OOOOOOOOOOOOOOOOOOOOOOOO+                  +OOOOOOOOOOOO
OOOOO+          +OOOOOOOOOOOOOOOOOOOOOOOO+                  +OOOOOOOOOOOO
OOOOO+          +OOOOOOOOOOOOOOOOOOOOOOOOO+                +OOOOOOOOOOOOO
OOOOO+          +OOOOOOOOOOOOOOOOOOOOOOOOOO+              +OOOOOOOOOOOOOO
OOOOO++++++++++++OOOOOOOOOOOOOOOOOOOOOOOOOOO++++++++++++++OOOOOOOOOOOOOOO
OOOOOOOOOOOOOOOOOOOOOOOOOOOOOOOOOOOOOOOOOOOOOOOOOOOOOOOOOOOOOOOOOOOOOOOOOCheck the indexes on k-fold split
Suppose you split a list of n words into splits of k=5, what are the indexes of the splits?
Pseudo-code:
for i in 0..5:
    start = n*i/k
    end   = n*(i+1)/k
Double check
Double check the above index formulas with words which have the same beginletter in a split (for easy validation).
1 2 3 4 5 6 7 8 9 10 11 12 13 14 15 16 | |
Output:
Split 0 of 5, length 7 : ['argot', 'along', 'addax', 'azans', 'aboil', 'aband', 'ayelp']
Split 1 of 5, length 7 : ['erred', 'ester', 'ekkas', 'entry', 'eldin', 'eruvs', 'ephas']
Split 2 of 5, length 7 : ['imino', 'islet', 'inurn', 'iller', 'idiom', 'izars', 'iring']
Split 3 of 5, length 7 : ['oches', 'outer', 'odist', 'orbit', 'ofays', 'outed', 'owned']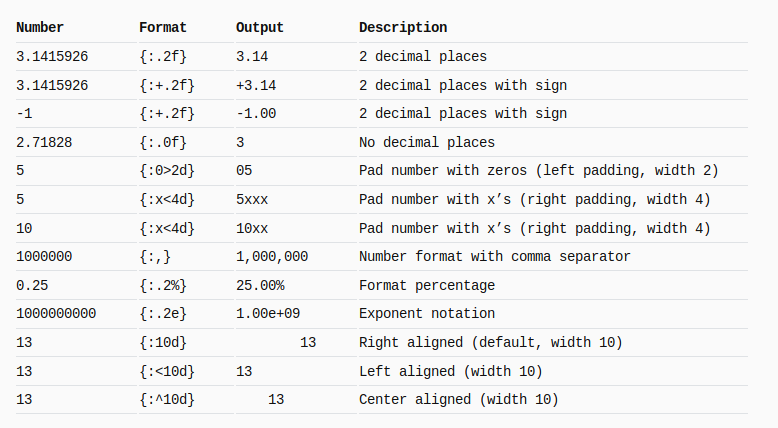
Split 4 of 5, length 7 : ['unlaw', 'upjet', 'upend', 'urged', 'urent', 'uncus', 'updry']Python string format
Following snap is taken from here: mkaz.blog/code/python-string-format-cookbook. Go there, there are more examples
Use the collections.counter to count the frequency of words in a text.
import collections

ln='''
The electrical and thermal conductivities of metals originate from
the fact that their outer electrons are delocalized. This situation
can be visualized by seeing the atomic structure of a metal as a
collection of atoms embedded in a sea of highly mobile electrons. The
electrical conductivity, as well as the electrons' contribution to
the heat capacity and heat conductivity of metals can be calculated
from the free electron model, which does not take into account the
detailed structure of the ion lattice.
When considering the electronic band structure and binding energy of
a metal, it is necessary to take into account the positive potential
caused by the specific arrangement of the ion cores - which is
periodic in crystals. The most important consequence of the periodic
potential is the formation of a small band gap at the boundary of the
Brillouin zone. Mathematically, the potential of the ion cores can be
treated by various models, the simplest being the nearly free
electron model.'''
Split the text into words:
words=ln.lower().split()Create a Counter:
ctr=collections.Counter(words)Most frequent:
ctr.most_common(10)

[('the', 22),
 ('of', 12),
 ('a', 5),
 ('be', 3),
 ('by', 3),
 ('ion', 3),
 ('can', 3),
 ('and', 3),
 ('is', 3),
 ('as', 3)]
Alternative: via df['col'].value_counts of pandas
import re
import pandas as pd

def removePunctuation(line):
    return  re.sub( "\s+"," ", re.sub( "[^a-zA-Z0-9 ]", "", line)).rstrip(' ').lstrip(' ').lower()

df=pd.DataFrame( [ removePunctuation(word.lower()) for word in ln.split() ], columns=['word'])
df['word'].value_counts()
Result:
the             22
of              12
a                5
and              3
by               3
as               3
ion              3
..
..Plot a couple of Gaussians
import numpy as np
from math import pi
from math import sqrt
import matplotlib.pyplot as plt


def gaussian(x, mu, sig):
    return 1./(sqrt(2.*pi)*sig)*np.exp(-np.power((x - mu)/sig, 2.)/2)

xv= map(lambda x: x/10.0, range(0,120,1))

mu= [ 2.0, 7.0, 9.0 ]
sig=[ 0.45, 0.70, 0.3 ]

for g in range(len(mu)):
    m=mu[g]
    s=sig[g]
    yv=map( lambda x: gaussian(x,m,s), xv )
    plt.plot(xv,yv)

plt.show()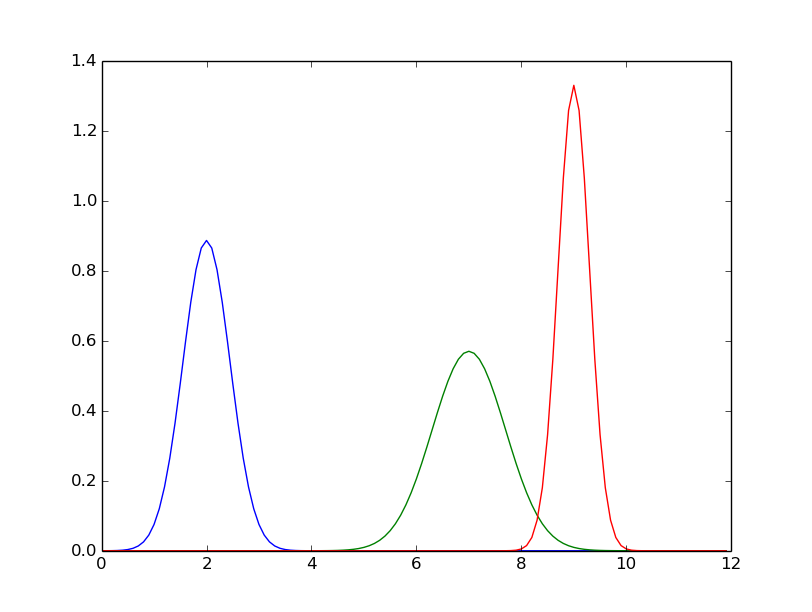
Incrementally update geocoded data
Startpoint: we have a sqlite3 database with (dirty) citynames and country codes. We would like to have the lat/lon coordinates, for each place.
Here some sample data, scraped from the Brussels marathon-results webpage, indicating the town of residence and nationality of the athlete:
LA CELLE SAINT CLOUD, FRA
TERTRE, BEL
FREDERICIA, DNK
But sometimes the town and country don't match up, eg:
HEVERLEE CHN
WOLUWE-SAINT-PIERRE JPN
BUIZINGEN FRA
For the geocoding we make use of nominatim.openstreetmap.org. The 3-letter country code also needs to be translated into a country name, for which we use the file /u01/data/20150215_country_code_iso/country_codes.txt.
The places for which we don't get valid (lat,lon) coordinates we put (0,0).
We run this script multiple times, small batches in the beginning, to be able see what the exceptions occur, and bigger batches in the end (when problems have been solved).
In between runs the data may be manually modified by opening the sqlite3 database, and updating/deleting the t_geocode table.
1 2 3 4 5 6 7 8 9 10 11 12 13 14 15 16 17 18 19 20 21 22 23 24 25 26 27 28 29 30 31 32 33 34 35 36 37 38 39 40 41 42 43 44 45 46 47 48 49 50 51 52 53 54 55 56 57 58 59 60 61 62 63 64 | |
A few queries
Total number of places:
select count(1) from t_geocode
916
Number of places for which we didn't find valid coordinates :
select count(1) from t_geocode where lat=0 and lon=0
185Startup a simple http server
python -m SimpleHTTPServerAnd yes, that's all there is to it.
Only serves HEAD and GET, uses the current directory as root.
For python 3 it goes like this:
python3 -m http.server 5000is and '=='
From blog.lerner.co.il/why-you-should-almost-never-use-is-in-python
a="beta"
b=a

id(a)
3072868832L

id(b)
3072868832L
Is the content of a and b the same? Yes.
a==b
True
Are a and b pointing to the same object?
a is b
True

id(a)==id(b)
True
So it's safer to use '==', but for example for comparing to None, it's more readable and faster when writing :
if x is None:
    print("x is None!")
This works because the None object is a singleton.
Join two dataframes, sql style
You have a number of users, and a number of transactions against those users. Join these 2 dataframes.
import pandas as pd User dataframe
ids= [9000, 9001, 9002, 9003, 9004, 9005, 9006, 9007, 9008]
nms=[u'Gerd Abrahamsson', u'Hanna Andersson', u'August Bergsten',
      u'Arvid Bohlin', u'Edvard Marklund', u'Ragnhild Br\xe4nnstr\xf6m',
      u'B\xf6rje Wallin', u'Otto Bystr\xf6m',u'Elise Dahlstr\xf6m']


udf=pd.DataFrame(ids, columns=['uid'])
udf['name']=nms
Content of udf:
    uid                 name
0  9000     Gerd Abrahamsson
1  9001      Hanna Andersson
2  9002      August Bergsten
3  9003         Arvid Bohlin
4  9004      Edvard Marklund
5  9005  Ragnhild Brännström
6  9006         Börje Wallin
7  9007         Otto Byström
8  9008      Elise Dahlström
Transaction dataframe
tids= [5000, 5001, 5002, 5003, 5004, 5005, 5006, 5007, 5008, 5009, 5010, 5011, 5012,
       5013, 5014, 5015, 5016, 5017, 5018, 5019, 5020]

uids= [9008, 9003, 9003, 9007, 9004, 9007, 9002, 9008, 9005, 9008, 9006, 9008, 9008,
       9005, 9005, 9001, 9000, 9003, 9002, 9001, 9004]

tamt= [498, 268, 621, -401, 720, -492, -153, 272, -250, 82, 549, -571, 814, -114,
      819, -404, -95, 428, -549, -462, -339]

tdt= ['2016-02-21 06:28:49', '2016-01-17 13:37:38', '2016-02-24 15:36:53',
      '2016-01-14 16:43:27', '2016-05-14 16:29:54', '2016-02-24 23:58:57',
      '2016-02-18 17:58:33', '2016-05-26 12:00:00', '2016-02-24 23:14:52',
      '2016-04-20 18:33:25', '2016-02-16 14:37:25', '2016-02-28 13:05:33',
      '2016-03-20 13:29:11', '2016-02-06 14:55:10', '2016-01-18 10:50:20',
      '2016-02-20 22:08:23', '2016-05-09 10:26:05', '2016-03-27 15:30:47',
      '2016-04-15 21:44:49', '2016-03-09 20:32:35', '2016-05-03 17:11:21']


tdf=pd.DataFrame(tids, columns=['xid'])
tdf['uid']=uids
tdf['amount']=tamt
tdf['date']=tdt
Content of tdf:
     xid   uid  amount                 date
0   5000  9008     498  2016-02-21 06:28:49
1   5001  9003     268  2016-01-17 13:37:38
2   5002  9003     621  2016-02-24 15:36:53
3   5003  9007    -401  2016-01-14 16:43:27
4   5004  9004     720  2016-05-14 16:29:54
5   5005  9007    -492  2016-02-24 23:58:57
6   5006  9002    -153  2016-02-18 17:58:33
7   5007  9008     272  2016-05-26 12:00:00
8   5008  9005    -250  2016-02-24 23:14:52
9   5009  9008      82  2016-04-20 18:33:25
10  5010  9006     549  2016-02-16 14:37:25
11  5011  9008    -571  2016-02-28 13:05:33
12  5012  9008     814  2016-03-20 13:29:11
13  5013  9005    -114  2016-02-06 14:55:10
14  5014  9005     819  2016-01-18 10:50:20
15  5015  9001    -404  2016-02-20 22:08:23
16  5016  9000     -95  2016-05-09 10:26:05
17  5017  9003     428  2016-03-27 15:30:47
18  5018  9002    -549  2016-04-15 21:44:49
19  5019  9001    -462  2016-03-09 20:32:35
20  5020  9004    -339  2016-05-03 17:11:21
Join sql-style: pd.merge
pd.merge( tdf, udf, how='inner', left_on='uid', right_on='uid')

     xid   uid  amount                 date                 name
0   5000  9008     498  2016-02-21 06:28:49      Elise Dahlström
1   5007  9008     272  2016-05-26 12:00:00      Elise Dahlström
2   5009  9008      82  2016-04-20 18:33:25      Elise Dahlström
3   5011  9008    -571  2016-02-28 13:05:33      Elise Dahlström
4   5012  9008     814  2016-03-20 13:29:11      Elise Dahlström
5   5001  9003     268  2016-01-17 13:37:38         Arvid Bohlin
6   5002  9003     621  2016-02-24 15:36:53         Arvid Bohlin
7   5017  9003     428  2016-03-27 15:30:47         Arvid Bohlin
8   5003  9007    -401  2016-01-14 16:43:27         Otto Byström
9   5005  9007    -492  2016-02-24 23:58:57         Otto Byström
10  5004  9004     720  2016-05-14 16:29:54      Edvard Marklund
11  5020  9004    -339  2016-05-03 17:11:21      Edvard Marklund
12  5006  9002    -153  2016-02-18 17:58:33      August Bergsten
13  5018  9002    -549  2016-04-15 21:44:49      August Bergsten
14  5008  9005    -250  2016-02-24 23:14:52  Ragnhild Brännström
15  5013  9005    -114  2016-02-06 14:55:10  Ragnhild Brännström
16  5014  9005     819  2016-01-18 10:50:20  Ragnhild Brännström
17  5010  9006     549  2016-02-16 14:37:25         Börje Wallin
18  5015  9001    -404  2016-02-20 22:08:23      Hanna Andersson
19  5019  9001    -462  2016-03-09 20:32:35      Hanna Andersson
20  5016  9000     -95  2016-05-09 10:26:05     Gerd Abrahamsson
Sidenote: fake data creation
This is the way the above fake data was created:
import random
from faker import Factory

fake = Factory.create('sv_SE')

ids=[]
nms=[]
for i in range(0,9):
    ids.append(9000+i)
    nms.append(fake.name())
    print "%d\t%s" % ( ids[i],nms[i])


tids=[]
uids=[]
tamt=[]
tdt=[]
sign=[-1,1]
for i in range(0,21):
    tids.append(5000+i)
    tamt.append(sign[random.randint(0,1)]*random.randint(80,900))
    uids.append(ids[random.randint(0,len(ids)-1)])
    tdt.append(str(fake.date_time_this_year()))
print "%d\t%d\t%d\t%s" % ( tids[i], tamt[i], uids[i], tdt[i])Plot with simple legend
Use 'label' in your plot() call.
import math
import matplotlib.pyplot as plt

xv= map( lambda x: (x/4.)-10., range(0,81))

for l in [ 0.1, 0.5, 1., 5.] :
    yv= map( lambda x: math.exp((-(-x)**2)/l), xv)
    plt.plot(xv,yv,label='lambda = '+str(l));

plt.legend()
plt.show()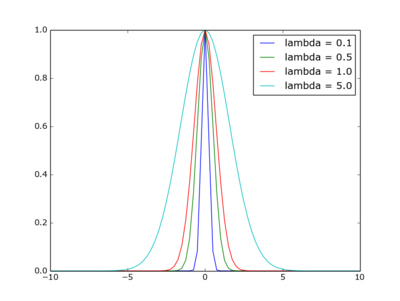
Sidenote: the function plotted is that of the Gaussian kernel in weighted nearest neighour regression, with xi=0
Linear Algebra MOOC
Odds of letters in scrable:
{'A':9/98, 'B':2/98, 'C':2/98, 'D':4/98, 'E':12/98, 'F':2/98,
'G':3/98, 'H':2/98, 'I':9/98, 'J':1/98, 'K':1/98, 'L':1/98,
'M':2/98, 'N':6/98, 'O':8/98, 'P':2/98, 'Q':1/98, 'R':6/98,
'S':4/98, 'T':6/98, 'U':4/98, 'V':2/98, 'W':2/98, 'X':1/98,
'Y':2/98, 'Z':1/98}
Use // to find the remainder
Remainder using modulo: 2304811 % 47 -> 25
Remainder using // : 2304811 - 47 * (2304811 // 47) -> 25
Infinity
Infinity: float('infinity') : 1/float('infinity') -> 0.0
Set
Test membership with 'in' and 'not in'.
Note the difference between set (curly braces!) and tuple:
sum( {1,2,3,2} )
6

sum( (1,2,3,2) )
8
Union of sets: use the bar operator { 1,2,4 } | { 1,3,5 } -> {1, 2, 3, 4, 5}
Intersection of sets: use the ampersand operator { 1,2,4 } & { 1,3,5 } -> {1}
Empty set: is not { } but set()! While for a list, the empty list is [].
Add / remove elements with .add() and .remove(). Add another set with .update()
s = { 1,2,4 }
s.update( { 1,3,5 } )
s
{1, 2, 3, 4, 5}
Intersect with another set:
s.intersection_update( { 4,5,6,7 } )
s
{4, 5}
Bind another variable to the same set: (any changes to s or t are visible to the other)
t=sMake a complete copy:
u=s.copy()Set comprehension:
{2*x for x in {1,2,3} }.. union of 2 sets combined with if (the if clause can be considered a filter) ..
s = { 1, 2,4 }

{ x for x in s|{5,6} if x>=2 }
{2, 4, 5, 6}
Double comprehension : iterate over the Cartesian product of two sets:
{x*y for x in {1,2,3} for y in {2,3,4}}
{2, 3, 4, 6, 8, 9, 12}
Compare to a list, which will return 2 more elements ( the 4 and the 6) :
[x*y for x in {1,2,3} for y in {2,3,4}]
[2, 3, 4, 4, 6, 8, 6, 9, 12]
Or producing tuples:
{ (x,y) for x in {1,2,3} for y in {2,3,4}}
{(1, 2), (1, 3), (1, 4), (2, 2), (2, 3), (2, 4), (3, 2), (3, 3), (3, 4)}
The factors of n:
n=64
{ (x,y) for x in range(1,1+int(math.sqrt(n))) for y in range(1,1+n) if (x*y)==n }
{(1, 64), (2, 32), (4, 16), (8, 8)}
Or use it in a loop:
 for n in range(40,100):
        print (n ,
            { (x,y) for x in range(1,1+int(math.sqrt(n))) for y in range(1,1+n) if (x*y)==n })
40 {(4, 10), (1, 40), (2, 20), (5, 8)}
41 {(1, 41)}
42 {(1, 42), (2, 21), (6, 7), (3, 14)}
43 {(1, 43)}
44 {(2, 22), (1, 44), (4, 11)}
45 {(1, 45), (3, 15), (5, 9)}
46 {(2, 23), (1, 46)}
47 {(1, 47)}
48 {(3, 16), (2, 24), (1, 48), (4, 12), (6, 8)}
..
Lists
- a list can contain other sets and lists, but a set cannot contain a list (since lists are mutable).
- order: respected for lists, but not for sets
concatenate lists using the '+' operator
provide second argument
[]to sum to make this work:sum([ [1,2,3], [4,5,6], [7,8,9] ], [])->[1, 2, 3, 4, 5, 6, 7, 8, 9]
Skip elements in a slice: use the colon separate triple a:b:c notation
L = [0,10,20,30,40,50,60,70,80,90]

L[::3]
[0, 30, 60, 90]
List of lists and comprehension:
listoflists = [[1,1],[2,4],[3, 9]]

[y for [x,y] in listoflists]
[1, 4, 9]
Tuples
- difference with lists: a tuple is immutable. So sets may contain tuples.
Unpacking in a comprehension:
 [y for (x,y) in [(1,'A'),(2,'B'),(3,'C')] ]
 ['A', 'B', 'C']

 [x[1] for x in [(1,'A'),(2,'B'),(3,'C')] ]
 ['A', 'B', 'C']
Converting list/set/tuple
Use constructors: set(), list() or tuple().
Note about range: a range represents a sequence, but it is not a list. Either iterate through the range or use set() or list() to turn it into a set or list.
Note about zip: it does not return a list, an 'iterator of tuples'.
Dictionary comprehensions
{ k:v for (k,v) in [(1,2),(3,4),(5,6)] }Iterate over the k,v pairs with items(), producing tuples:
[ item for item in {'a':1, 'b':2, 'c':3}.items()  ]
[('a', 1), ('c', 3), ('b', 2)]
Modules
- create your own module: name it properly, eg "spacerocket.py"
- import it in another script
While debugging it may be easier to use 'reload' (from package imp) to reload your module
Various
The enumerate function.
list(enumerate(['A','B','C']))
[(0, 'A'), (1, 'B'), (2, 'C')]


[ (i+1)*s for (i,s) in enumerate(['A','B','C','D','E'])]
['A', 'BB', 'CCC', 'DDDD', 'EEEEE']Python documentation links
- matplotlib
Add a column of zeros to a matrix
x= np.array([ [9.,4.,7.,3.], [ 2., 0., 3., 4.], [ 1.,2.,3.,1.] ])

array([[ 9.,  4.,  7.,  3.],
       [ 2.,  0.,  3.,  4.],
       [ 1.,  2.,  3.,  1.]])
Add the column:
np.c_[ np.zeros(3), x]

array([[ 0.,  9.,  4.,  7.,  3.],
       [ 0.,  2.,  0.,  3.,  4.],
       [ 0.,  1.,  2.,  3.,  1.]])
Watchout: np.c_ takes SQUARE brackets, not parenthesis!
There is also an np.r_[ ... ] function. Maybe also have a look at vstack and hstack. See stackoverflow.com/a/8505658/4866785 for examples.
Matrix multiplication : dot product
a= np.array([[2., -1., 0.],[-3.,6.0,1.0]])

array([[ 2., -1.,  0.],
       [-3.,  6.,  1.]])


b= np.array([ [1.0,0.0,-1.0,2],[-4.,3.,1.,0.],[0.,3.,0.,-2.]])

array([[ 1.,  0., -1.,  2.],
       [-4.,  3.,  1.,  0.],
       [ 0.,  3.,  0., -2.]])

np.dot(a,b)

array([[  6.,  -3.,  -3.,   4.],
       [-27.,  21.,   9.,  -8.]])
Dot product of two vectors
Take the first row of above a matrix and the first column of above b matrix:
np.dot( np.array([ 2., -1.,  0.]), np.array([ 1.,-4.,0. ]) )
6.0
Normalize a matrix
Normalize the columns: suppose the columns make up the features, and the rows the observations.
Calculate the 'normalizers':
norms=np.linalg.norm(a,axis=0)

print norms
[ 3.60555128  6.08276253  1. ]
Turn a into normalized matrix an:
an = a/norms

print an

[[ 0.5547002  -0.16439899  0.        ]
[-0.83205029 0.98639392 1. ]]Dot product used for aggregation of an unrolled matrix
Aggregations by column/row on an unrolled matrix, done via dot product. No need to reshape.
Column sums
Suppose this 'flat' array ..
a=np.array( [1, 2, 3, 4, 5, 6, 7, 8, 9, 10, 11, 12 ] ).. represents an 'unrolled' 3x4 matrix ..
a.reshape(3,4)

array([[ 1,  2,  3,  4],
       [ 5,  6,  7,  8],
       [ 9, 10, 11, 12]])
.. of which you want make the sums by column ..
a.reshape(3,4).sum(axis=0)
array([15, 18, 21, 24])
This can also be done by the dot product of a tiled eye with the array!
np.tile(np.eye(4),3)

array([[ 1,  0,  0,  0,  1,  0,  0,  0,  1,  0,  0,  0],
       [ 0,  1,  0,  0,  0,  1,  0,  0,  0,  1,  0,  0],
       [ 0,  0,  1,  0,  0,  0,  1,  0,  0,  0,  1,  0],
       [ 0,  0,  0,  1,  0,  0,  0,  1,  0,  0,  0,  1]])
Dot product:
np.tile(np.eye(4),3).dot(a)
array([ 15.,  18.,  21.,  24.])
Row sums
Similar story :
a.reshape(3,4)
array([[ 1,  2,  3,  4],
       [ 5,  6,  7,  8],
       [ 9, 10, 11, 12]])
Sum by row:
a.reshape(3,4).sum(axis=1)
array([10, 26, 42])
Can be expressed by a Kronecker eye-onesie :
np.kron( np.eye(3), np.ones(4) )

array([[ 1,  1,  1,  1,  0,  0,  0,  0,  0,  0,  0,  0],
       [ 0,  0,  0,  0,  1,  1,  1,  1,  0,  0,  0,  0],
       [ 0,  0,  0,  0,  0,  0,  0,  0,  1,  1,  1,  1]])
Dot product:
np.kron( np.eye(3), np.ones(4) ).dot(a)
array([ 10.,  26.,  42.])
For the np.kron() function see Kronecker product
The dot product of two matrices (Eg. a matrix and it's tranpose), equals the sum of the outer products of the row-vectors & column-vectors.
a=np.matrix( "1 2; 3 4; 5 6" )

matrix([[1, 2],
        [3, 4],
        [5, 6]])
Dot product of A and A^T :
np.dot( a, a.T)

matrix([[ 5, 11, 17],
        [11, 25, 39],
        [17, 39, 61]])
Or as the sum of the outer products of the vectors:
np.outer(a[:,0],a.T[0,:])

array([[ 1,  3,  5],
       [ 3,  9, 15],
       [ 5, 15, 25]])

np.outer(a[:,1],a.T[1,:])

array([[ 4,  8, 12],
       [ 8, 16, 24],
       [12, 24, 36]])
.. added up..
np.outer(a[:,0],a.T[0,:]) + np.outer(a[:,1],a.T[1,:])

array([[ 5, 11, 17],
       [11, 25, 39],
       [17, 39, 61]])
.. and yes it is the same as the dot product!
Note: for above, because we are forming the dot product of a matrix with its transpose, we can also write it as (not using the transpose) :
np.outer(a[:,0],a[:,0]) + np.outer(a[:,1],a[:,1])Minimum and maximum int
- Max: sys.maxint
- Min: -sys.maxint-1
Named Tuple
Name the fields of your tuples
- namedtuple : factory function for creating tuple subclasses with named fields
- returns a new tuple subclass named typename.
- the new subclass is used to create tuple-like objects that have fields accessible by attribute lookup as well as being indexable and iterable.
Code:
import collections

Coord = collections.namedtuple('Coord', ['x','y'], verbose=False)

a=[ Coord(100.0,20.0), Coord(5.0,10.0), Coord(99.0,66.0) ]
Access tuple elements by index:
a[1][0]
5.0
Access tuple elements by name:
a[1].x
5.0
Set verbose=True to see the code:
Coord = collections.namedtuple('Coord', ['x','y'], verbose=True)

class Coord(tuple):
    'Coord(x, y)'

    __slots__ = ()

    _fields = ('x', 'y')

    def __new__(_cls, x, y):
        'Create new instance of Coord(x, y)'
        return _tuple.__new__(_cls, (x, y))

    @classmethod
    def _make(cls, iterable, new=tuple.__new__, len=len):
        'Make a new Coord object from a sequence or iterable'
        result = new(cls, iterable)
        if len(result) != 2:
            raise TypeError('Expected 2 arguments, got %d' % len(result))
        return result

    def __repr__(self):
        'Return a nicely formatted representation string'
        return 'Coord(x=%r, y=%r)' % self

    def _asdict(self):
        'Return a new OrderedDict which maps field names to their values'
        return OrderedDict(zip(self._fields, self))

    def _replace(_self, **kwds):
        'Return a new Coord object replacing specified fields with new values'
        result = _self._make(map(kwds.pop, ('x', 'y'), _self))
        if kwds:
            raise ValueError('Got unexpected field names: %r' % kwds.keys())
        return result

    def __getnewargs__(self):
        'Return self as a plain tuple.  Used by copy and pickle.'
        return tuple(self)

    __dict__ = _property(_asdict)

    def __getstate__(self):
        'Exclude the OrderedDict from pickling'
        pass

    x = _property(_itemgetter(0), doc='Alias for field number 0')

y = _property(_itemgetter(1), doc='Alias for field number 1')'Null' value in Python is 'None'
There's always only one instance of this object, so you can check for equivalence with
x is None(identity comparison) instead ofx == None
stackoverflow.com/questions/3289601/null-object-in-python
Missing data in Python
Roughly speaking:
- missing 'object' -> None
- missing numerical value ->Nan ( np.nan )
Pandas handles both nearly interchangeably, converting if needed.
- isnull(), notnull() generates boolean mask indicating missing (or not) values
- dropna() return filtered version of data
- fillna() impute the missing values
More detail: jakevdp.github.io/PythonDataScienceHandbook/03.04-missing-values.html
Sample with replacement
Create a vector composed of randomly selected elements of a smaller vector. Ie. sample with replacement.
import numpy as np
src_v=np.array([1,2,3,5,8,13,21])

trg_v= src_v[np.random.randint( len(src_v), size=30)]

array([ 3,  8, 21,  5,  3,  3, 21,  5, 21,  3,  2, 13,  3, 21,  2,  2, 13,
5, 3, 21, 1, 2, 13, 3, 5, 3, 8, 8, 3, 1])Numpy quickies
Create a matrix of 6x2 filled with random integers:
import numpy as np
ra= np.matrix( np.reshape( np.random.randint(1,10,12), (6,2) ) )

matrix([[6, 1],
        [3, 8],
        [3, 9],
        [4, 2],
        [4, 7],
[3, 9]])The magic matrices (a la octave).
23 24 25 26 27 28 29 30 31 32 33 34 35 36 37 38 39 40 41 42 43 44 45 46 47 48 49 50 51 52 53 54 55 56 57 58 | |
Sum column-wise (ie add up the elements for each column):
np.sum(magic3,axis=0)
array([15, 15, 15])
Sum row-wise (ie add up elements for each row):
np.sum(magic3,axis=1)
array([15, 15, 15])
Okay, a magic matrix is maybe not the best way to show row/column wise sums. Consider this:
rc= np.array([[0, 1, 2, 3, 4, 5],
              [0, 1, 2, 3, 4, 5],
              [0, 1, 2, 3, 4, 5]])

np.sum(rc,axis=0)           # sum over rows
[0,  3,  6,  9, 12, 15]

np.sum(rc,axis=1)           # sum over columns
[15,
 15,
 15]

np.sum(rc)                  # sum every element
45Simple OO program
Also from Dr. Chuck.
class PartyAnimal:
   x = 0

   def party(self) :
     self.x = self.x + 1
     print "So far",self.x

an = PartyAnimal()

an.party()
an.party()
an.party()
Class with constructor / destructor
class PartyAnimal:
   x = 0

   def __init__(self):
     print "I am constructed"

   def party(self) :
     self.x = self.x + 1
     print "So far",self.x

   def __del__(self):
     print "I am destructed", self.x

an = PartyAnimal()
an.party()
an.party()
an.party()
Field name added to Class
class PartyAnimal:
   x = 0
   name = ""

   def __init__(self, nam):
     self.name = nam
     print self.name,"constructed"

   def party(self) :
     self.x = self.x + 1
     print self.name,"party count",self.x

s = PartyAnimal("Sally")
s.party()

j = PartyAnimal("Jim")
j.party()
s.party()
Inheritance
class PartyAnimal:
   x = 0
   name = ""
   def __init__(self, nam):
     self.name = nam
     print self.name,"constructed"

   def party(self) :
     self.x = self.x + 1
     print self.name,"party count",self.x

class FootballFan(PartyAnimal):
   points = 0
   def touchdown(self):
      self.points = self.points + 7
      self.party()
      print self.name,"points",self.points

s = PartyAnimal("Sally")
s.party()

j = FootballFan("Jim")
j.party()
j.touchdown()Interesting blog post.
OpenStreetMap city blocks as GeoJSON polygons
Extracting blocks within a city as GeoJSON polygons from OpenStreetMap data
I'll talk about using QGIS software to explore and visualize LARGE maps and provide a Python script (you don't need QGIS for this) for converting lines that represent streets to polygons that represent city blocks. The script will use the polygonize function from Shapely but you need to preprocess the OSM data first which is the secret sauce.
peteris.rocks/blog/openstreetmap-city-blocks-as-geojson-polygons
Summary:
- Download GeoJSON files from Mapzen Metro Extracts
- Filter lines with filter.py
- Split LineStrings with multiple points to LineStrings with two points with split-lines.py
- Create polygons with polygonize.py
- Look at results with QGIS or geojson.io
GeoJSON: geojson.io/#map=14/-14.4439/28.4334
Intro:
I admit that I was a huge fan of the Python setuptools library for a long time. There was a lot in there which just resonated with how I thought that software development should work. I still think that the design of setuptools is amazing. Nobody would argue that setuptools was flawless and it certainly failed in many regards. The biggest problem probably was that it was build on Python's idiotic import system but there is only so little you can do about that. In general setuptools took the realistic approach to problem-solving: do the best you can do by writing a piece of software scratches the itch without involving a committee or require language changes. That also somewhat explains the second often cited problem of setuptools: that it's a monkeypatch on distutils.
Talks about: setuptools, distutils, .pth files, PIL, eggs, ..
Convert a Garmin .FIT file and plot the heartrate of your run
Use gpsbabel to turn your FIT file into CSV:
gpsbabel -t -i garmin_fit -f 97D54119.FIT -o unicsv -F 97D54119.csvPandas imports:
import pandas as pd
import math
import matplotlib.pyplot as plt

pd.options.display.width=150
Read the CSV file:
df=pd.read_csv('97D54119.csv',sep=',',skip_blank_lines=False)Show some points:
df.head(500).tail(10)


      No   Latitude  Longitude  Altitude  Speed  Heartrate  Cadence        Date      Time
490  491  50.855181   4.826737      78.2   2.79        144     78.0  2019/07/13  06:44:22
491  492  50.855136   4.826739      77.6   2.79        147     78.0  2019/07/13  06:44:24
492  493  50.854962   4.826829      76.2   2.77        148     77.0  2019/07/13  06:44:32
493  494  50.854778   4.826951      77.4   2.77        146     78.0  2019/07/13  06:44:41
494  495  50.854631   4.827062      78.0   2.71        143     78.0  2019/07/13  06:44:49
495  496  50.854531   4.827174      79.2   2.70        146     77.0  2019/07/13  06:44:54
496  497  50.854472   4.827249      79.2   2.73        149     77.0  2019/07/13  06:44:57
497  498  50.854315   4.827418      79.8   2.74        149     76.0  2019/07/13  06:45:05
498  499  50.854146   4.827516      77.4   2.67        147     76.0  2019/07/13  06:45:14
499  500  50.853985   4.827430      79.0   2.59        144     75.0  2019/07/13  06:45:22
Function to compute the distance (approximately) :
#  function to approximately calculate the distance between 2 points
#  from: http://www.movable-type.co.uk/scripts/latlong.html
def rough_distance(lat1, lon1, lat2, lon2):
    lat1 = lat1 * math.pi / 180.0
    lon1 = lon1 * math.pi / 180.0
    lat2 = lat2 * math.pi / 180.0
    lon2 = lon2 * math.pi / 180.0
    r = 6371.0 #// km
    x = (lon2 - lon1) * math.cos((lat1+lat2)/2)
    y = (lat2 - lat1)
    d = math.sqrt(x*x+y*y) * r
    return d
Compute the distance:
ds=[]
(d,priorlat,priorlon)=(0.0, 0.0, 0.0)
for t in df[['Latitude','Longitude']].itertuples():
    if len(ds)>0:
        d+=rough_distance(t.Latitude,t.Longitude, priorlat, priorlon)
    ds.append(d)
    (priorlat,priorlon)=(t.Latitude,t.Longitude)

df['CumulativeDist']=ds
Let's plot!
df.plot(kind='line',x='CumulativeDist',y='Heartrate',color='red')
plt.show() 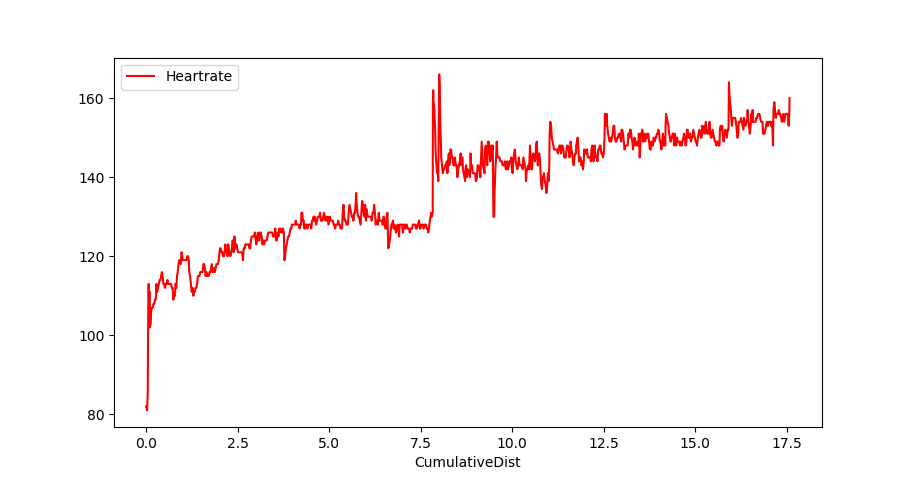
Or multiple columns:
plt.plot( df.CumulativeDist, df.Heartrate, color='red')
plt.plot( df.CumulativeDist, df.Altitude, color='blue')
plt.show()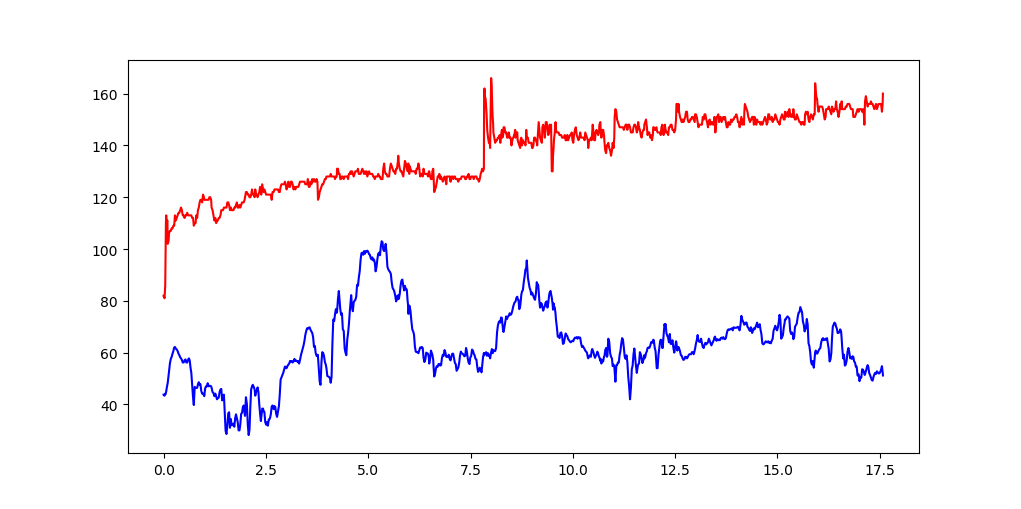
Turn a pandas dataframe into a dictionary
eg. create a mapping of a 3 digit code to a country name
BEL -> Belgium
CHN -> China
FRA -> France
..
Code:
df=pd.io.parsers.read_table(
    '/u01/data/20150215_country_code_iso/country_codes.txt',
    sep='|')

c3d=df.set_index('c3')['country'].to_dict()
Result:
c3d['AUS']
'Australia'

c3d['GBR']
'United Kingdom'eg. read a csv file that has nasty quotes, and save it as tab-separated.
import pandas as pd
import csv

colnames= ["userid", "movieid", "tag", "timestamp"]

df=pd.io.parsers.read_table("tags.csv",
                sep=",", header=0, names= colnames,
                quoting=csv.QUOTE_ALL)
Write:
df.to_csv('tags.tsv', index=False, sep='\t')Dataframe aggregation fun
Load the city dataframe into dataframe df.
Summary statistic of 1 column
df.population.describe()

count    2.261100e+04
mean     1.113210e+05
std      4.337739e+05
min      0.000000e+00
25%      2.189950e+04
50%      3.545000e+04
75%      7.402450e+04
max      1.460851e+07
Summary statistic per group
Load the city dataframe into df, then:
t1=df[['country','population']].groupby(['country'])
t2=t1.agg( ['min','mean','max','count'])
t2.sort_values(by=[ ('population','count') ],ascending=False).head(20)
Output:
        population
               min           mean       max count
country
US           15002   62943.294138   8175133  2900
IN           15007  109181.708924  12691836  2398
BR               0  104364.320502  10021295  1195
DE               0   57970.979716   3426354   986
RU           15048  101571.065195  10381222   951
CN           15183  357967.030457  14608512   788
JP           15584  136453.906915   8336599   752
IT             895   49887.442136   2563241   674
GB           15024   81065.611200   7556900   625
FR           15009   44418.920455   2138551   616
ES           15006   65588.432282   3255944   539
MX           15074  153156.632735  12294193   501
PH           15066  100750.534884  10444527   430
TR           15058  142080.305263  11174257   380
ID           17504  170359.848901   8540121   364
PL           15002   64935.379421   1702139   311
PK           15048  160409.378641  11624219   309
NL           15071   53064.727626    777725   257
UA           15012  103468.816000   2514227   250
NG           15087  205090.336207   9000000   232
Note on selecting a multilevel column
Eg. select 'min' via tuple ('population','min').
t2[ t2[('population','min')]>50000 ]

        population
               min          mean      max count
country
BB           98511  9.851100e+04    98511     1
CW          125000  1.250000e+05   125000     1
HK          288728  3.107000e+06  7012738     3
MO          520400  5.204000e+05   520400     1
MR           72337  3.668685e+05   661400     2
MV          103693  1.036930e+05   103693     1
SB           56298  5.629800e+04    56298     1
SG         3547809  3.547809e+06  3547809     1
ST           53300  5.330000e+04    53300     1
TL 150000 1.500000e+05 150000 1Read data from a zipfile into a dataframe
import pandas as pd
import zipfile

z = zipfile.ZipFile("lending-club-data.csv.zip")
df=pd.io.parsers.read_table(z.open("lending-club-data.csv"), sep=",")
z.close()Calculate the cumulative distance of gps trackpoints
Prep:
import pandas as pd
import math
Function to calculate the distance:
#  function to approximately calculate the distance between 2 points
#  from: http://www.movable-type.co.uk/scripts/latlong.html
def rough_distance(lat1, lon1, lat2, lon2):
    lat1 = lat1 * math.pi / 180.0
    lon1 = lon1 * math.pi / 180.0
    lat2 = lat2 * math.pi / 180.0
    lon2 = lon2 * math.pi / 180.0
    r = 6371.0 #// km
    x = (lon2 - lon1) * math.cos((lat1+lat2)/2)
    y = (lat2 - lat1)
    d = math.sqrt(x*x+y*y) * r
    return d
Read data:
df=pd.io.parsers.read_table("trk.tsv",sep="\t")

# drop some columns (for clarity)
df=df.drop(['track','ele','tm_str'],axis=1)
Sample:
df.head()

         lat       lon
0  50.848408  4.787456
1  50.848476  4.787367
2  50.848572  4.787275
3  50.848675  4.787207
4  50.848728  4.787189
The prior-latitude column is the latitude column shifted by 1 unit:
df['prior_lat']= df['lat'].shift(1)
prior_lat_ix=df.columns.get_loc('prior_lat')
df.iloc[0,prior_lat_ix]= df.lat.iloc[0]
The prior-longitude column is the longitude column shifted by 1 unit:
df['prior_lon']= df['lon'].shift(1)
prior_lon_ix=df.columns.get_loc('prior_lon')
df.iloc[0,prior_lon_ix]= df.lon.iloc[0]
Calculate the distance:
df['dist']= df[ ['lat','lon','prior_lat','prior_lon'] ].apply(
                        lambda r : rough_distance ( r[0], r[1], r[2], r[3]) , axis=1)
Calculate the cumulative distance
cum=0
cum_dist=[]
for d in df['dist']:
    cum=cum+d
    cum_dist.append(cum)

df['cum_dist']=cum_dist
Sample:
df.head()

         lat       lon  prior_lat  prior_lon      dist  cum_dist
0  50.848408  4.787456  50.848408   4.787456  0.000000  0.000000
1  50.848476  4.787367  50.848408   4.787456  0.009831  0.009831
2  50.848572  4.787275  50.848476   4.787367  0.012435  0.022266
3  50.848675  4.787207  50.848572   4.787275  0.012399  0.034665
4  50.848728  4.787189  50.848675   4.787207  0.006067  0.040732


df.tail()

            lat       lon  prior_lat  prior_lon      dist   cum_dist
1012  50.847164  4.788163  50.846962   4.788238  0.023086  14.937470
1013  50.847267  4.788134  50.847164   4.788163  0.011634  14.949104
1014  50.847446  4.788057  50.847267   4.788134  0.020652  14.969756
1015  50.847630  4.787978  50.847446   4.788057  0.021097  14.990853
1016 50.847729 4.787932 50.847630 4.787978 0.011496 15.002349Onehot encode the categorical data of a data-frame
.. using the pandas get_dummies function.
Data:
import StringIO
import pandas as pd

data_strio=StringIO.StringIO('''category   reason         species
Decline    Genuine        24
Improved   Genuine        16
Improved   Misclassified  85
Decline    Misclassified  41
Decline    Taxonomic      2
Improved   Taxonomic      7
Decline    Unclear        41
Improved   Unclear        117''')

df=pd.read_fwf(data_strio)
One hot encode 'category':
cat_oh= pd.get_dummies(df['category'])
cat_oh.columns= map( lambda x: "cat__"+x.lower(), cat_oh.columns.values)

cat_oh

   cat__decline  cat__improved
0             1              0
1             0              1
2             0              1
3             1              0
4             1              0
5             0              1
6             1              0
7             0              1
Do the same for 'reason' :
reason_oh= pd.get_dummies(df['reason'])
reason_oh.columns= map( lambda x: "rsn__"+x.lower(), reason_oh.columns.values)
Combine
Combine the columns into a new dataframe:
ohdf= pd.concat( [ cat_oh, reason_oh, df['species']], axis=1)Result:
ohdf

   cat__decline  cat__improved  rsn__genuine  rsn__misclassified  \
0             1              0             1                   0
1             0              1             1                   0
2             0              1             0                   1
3             1              0             0                   1
4             1              0             0                   0
5             0              1             0                   0
6             1              0             0                   0
7             0              1             0                   0

   rsn__taxonomic  rsn__unclear  species
0               0             0       24
1               0             0       16
2               0             0       85
3               0             0       41
4               1             0        2
5               1             0        7
6               0             1       41
7               0             1      117
Or if the 'drop' syntax on the dataframe is more convenient to you:
ohdf= pd.concat( [ cat_oh, reason_oh,
            df.drop(['category','reason'], axis=1) ],
axis=1)Read a fixed-width datafile inline
import StringIO
import pandas as pd

data_strio=StringIO.StringIO('''category   reason         species
Decline    Genuine        24
Improved   Genuine        16
Improved   Misclassified  85
Decline    Misclassified  41
Decline    Taxonomic      2
Improved   Taxonomic      7
Decline    Unclear        41
Improved   Unclear        117''')
Turn the string_IO into a dataframe:
df=pd.read_fwf(data_strio)Check the content:
df

   category         reason  species
0   Decline        Genuine       24
1  Improved        Genuine       16
2  Improved  Misclassified       85
3   Decline  Misclassified       41
4   Decline      Taxonomic        2
5  Improved      Taxonomic        7
6   Decline        Unclear       41
7  Improved        Unclear      117
The "5-number" summary
df.describe()

          species
count    8.000000
mean    41.625000
std     40.177952
min      2.000000
25%     13.750000
50%     32.500000
75%     52.000000
max    117.000000
Drop a column
df=df.drop('reason',axis=1) Result:
   category  species
0   Decline       24
1  Improved       16
2  Improved       85
3   Decline       41
4   Decline        2
5  Improved        7
6   Decline       41
7 Improved 117Create an empty dataframe
10 11 12 13 14 15 16 17 | |
Other way
24 25 | |
Quickies
You want to pandas to print more data on your wide terminal window?
pd.set_option('display.line_width', 200)You want to make the max column width larger?
pd.set_option('max_colwidth',80)Add two dataframes
Add the contents of two dataframes, having the same index
a=pd.DataFrame( np.random.randint(1,10,5), index=['a', 'b', 'c', 'd', 'e'], columns=['val'])
b=pd.DataFrame( np.random.randint(1,10,3), index=['b', 'c', 'e'],columns=['val'])

a
   val
a    5
b    7
c    8
d    8
e    1

b
   val
b    9
c    2
e    5

a+b
   val
a  NaN
b   16
c   10
d  NaN
e    6

a.add(b,fill_value=0)
   val
a    5
b   16
c   10
d    8
e 6Read/write csv
Read:
pd.read_csv('in.csv')Write:
<yourdataframe>.to_csv('out.csv',header=False, index=False ) Load a csv file
Load the following csv file. Difficulty: the date is spread over 3 fields.
    2014, 8, 5, IBM, BUY, 50,
    2014, 10, 9, IBM, SELL, 20 ,
    2014, 9, 17, PG, BUY, 10,
    2014, 8, 15, PG, SELL, 20 ,
The way I implemented it:
10 11 12 13 14 15 16 17 18 19 20 21 22 | |
An alternative way,... it's better because the date is converted on reading, and the dataframe is indexed by the date.
|
Pie chart
Make a pie-chart of the top-10 number of cities per country in the file cities15000.txt
import pandas as pd
import matplotlib.pyplot as plt
Load city data, but only the country column.
colnames= [ "country" ]
df=pd.io.parsers.read_table("/usr/share/libtimezonemap/ui/cities15000.txt",
                sep="\t", header=None, names= colnames,
                usecols=[ 8 ])
Get the counts:
cnts=df['country'].value_counts()

total_cities=cnts.sum()
22598
Keep the top 10:
t10=cnts.order(ascending=False)[:10]

US    2900
IN    2398
BR    1195
DE     986
RU     951
CN     788
JP     752
IT     674
GB     625
FR     616
What are the percentages ? (to display in the label)
pct=t10.map( lambda x: round((100.*x)/total_cities,2)).values

array([ 12.83,  10.61,   5.29,   4.36,   4.21,   3.49,   3.33,   2.98, 2.77,   2.73])
Labels: country-name + percentage
labels=[ "{} ({}%)".format(cn,pc) for (cn,pc) in  zip( t10.index.values, pct)]

['US (12.83%)', 'IN (10.61%)', 'BR (5.29%)', 'DE (4.36%)', 'RU (4.21%)', 'CN (3.49%)',
 'JP (3.33%)', 'IT (2.98%)', 'GB (2.77%)', 'FR (2.73%)']
Values:
values=t10.values

array([2900, 2398, 1195,  986,  951,  788,  752,  674,  625,  616])
Plot
plt.style.use('ggplot')
plt.title('Number of Cities per Country\nIn file cities15000.txt')
plt.pie(values,labels=labels)
plt.show()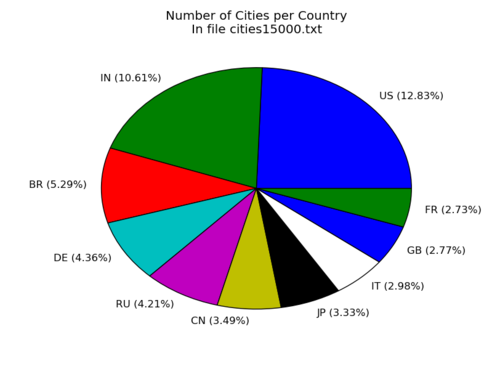
A good starting place:
matplotlib.org/mpl_toolkits/mplot3d/tutorial.html
Simple 3D scatter plot
Preliminary
from mpl_toolkits.mplot3d import axes3d
import matplotlib.pyplot as plt
import numpy as np
Data : create matrix X,Y,Z
X=[ [ i for i in range(0,10) ], ]*10
Y=np.transpose(X)

Z=[]
for i in range(len(X)):
    R=[]
    for j in range(len(Y)):
        if i==j: R.append(2)
        else: R.append(1)
    Z.append(R)
X:
[[0, 1, 2, 3, 4],
 [0, 1, 2, 3, 4],
 [0, 1, 2, 3, 4],
 [0, 1, 2, 3, 4],
 [0, 1, 2, 3, 4]]
Y:
[[0, 0, 0, 0, 0],
 [1, 1, 1, 1, 1],
 [2, 2, 2, 2, 2],
 [3, 3, 3, 3, 3],
 [4, 4, 4, 4, 4]])
Z:
[[2, 1, 1, 1, 1],
 [1, 2, 1, 1, 1],
 [1, 1, 2, 1, 1],
 [1, 1, 1, 2, 1],
 [1, 1, 1, 1, 2]]
Scatter plot
fig = plt.figure()
ax = fig.add_subplot(111, projection='3d')
ax.scatter(X, Y, Z)
plt.show()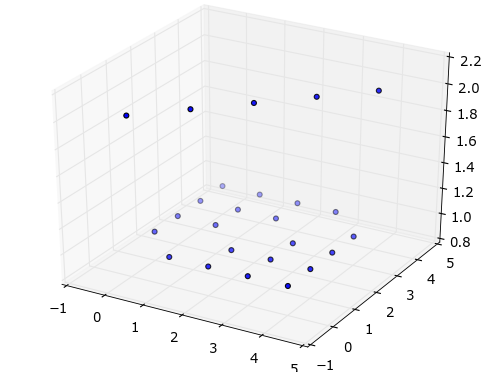
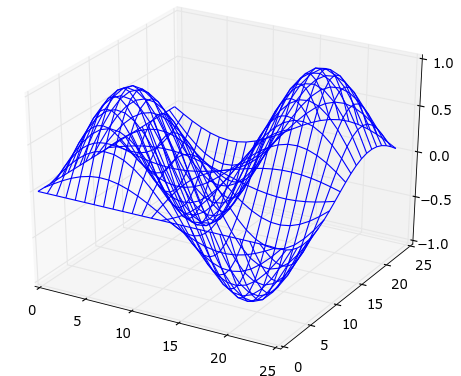
Wireframe plot
1 2 3 4 5 6 7 8 9 10 11 12 13 14 15 16 17 18 19 20 21 22 23 | |
Plot a function
eg. you want a plot of function: f(w) = 5-(w-10)² for w in the range 0..19
import matplotlib.pyplot as plt

x=range(20)
y=map( lambda w: 5-(w-10)**2, x)
plt.plot(x,y)
plt.show()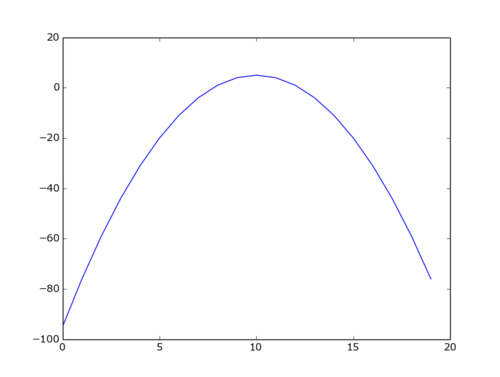
Plot some points
Imagine you have a list of tuples, and you want to plot these points:
l = [(1, 9), (2, 5), (3, 7)]And the plotting function expects to receive the x and y coordinate as separate lists.
First some fun with zip:
print(l)
[(1, 9), (2, 5), (3, 7)]

print(*l)
(1, 9) (2, 5) (3, 7)

print(*zip(*l))
(1, 2, 3) (9, 5, 7)
Got it? Okay, let's plot.
plt.scatter(*zip(*pl))
plt.show()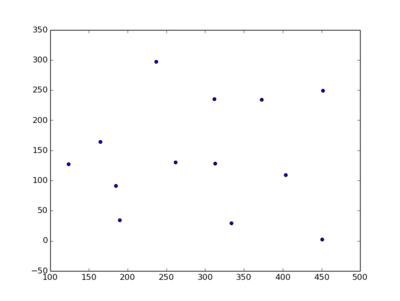
Define a point class
- with an x and y member
- with methods to 'autoprint'
Definition
import math

class P:
    x=0
    y=0
    def __init__(self,x,y):
        self.x=x
        self.y=y

    # gets called when a print is executed
    def __str__(self):
        return "x:{} y:{}".format(self.x,self.y)

    # gets called eg. when a print is executed on an array of P's
    def __repr__(self):
        return "x:{} y:{}".format(self.x,self.y)


# convert an array of arrays or tuples to array of points
def convert(in_ar) :
    out_ar=[]
    for el in in_ar:
        out_ar.append( P(el[0],el[1]) )
    return out_ar
How to initialize
Eg. create a list of points
# following initialisations lead to the same array of points (note the convert)
p=[P(0,0),P(0,1),P(-0.866025,-0.5),P(0.866025,0.5)]
q=convert( [[0,0],[0,1],[-0.866025,-0.5],[0.866025,0.5]] )
r=convert( [(0,0),(0,1),(-0.866025,-0.5),(0.866025,0.5)] )

print type(p), ' | ' , p[2].x, p[2].y,  ' | ', p[2]
print type(q), ' | ' , q[2].x, q[2].y,  ' | ', q[2]
print type(r), ' | ' , r[2].x, r[2].y,  ' | ', r[2]
Output:
<type 'list'>  |  -0.866025 -0.5  |  x:-0.866025 y:-0.5
<type 'list'>  |  -0.866025 -0.5  |  x:-0.866025 y:-0.5
<type 'list'>  |  -0.866025 -0.5  |  x:-0.866025 y:-0.5
How to use
eg. Calculate the angle between :
- the horizontal line through the first point
- and the line through the two points
Then convert the result from radians to degrees: (watchout: won't work for dx==0)
print math.atan( ( p[3].y - p[0].y ) / ( p[3].x - p[0].x ) ) * 180.0/math.piOutput:
30.0000115676Generate n numbers in an interval
Return evenly spaced numbers over a specified interval.
Pre-req:
import numpy as np
import matplotlib.pyplot as plt
In linear space
y=np.linspace(0,90,num=10)
array([  0.,  10.,  20.,  30.,  40.,  50.,  60.,  70.,  80.,  90.])

x=[ i for i in range(len(y)) ]
[0, 1, 2, 3, 4, 5, 6, 7, 8, 9]

plt.plot(x,y)
plt.scatter(x,y)
plt.title("linspace")
plt.show()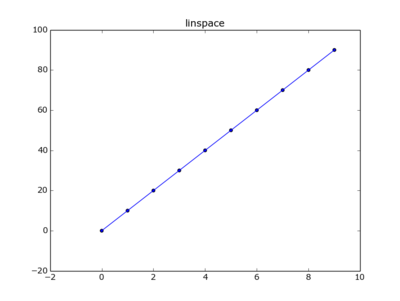
In log space
y=np.logspace(0, 9, num=10)

array([  1.00000000e+00,   1.00000000e+01,   1.00000000e+02,
         1.00000000e+03,   1.00000000e+04,   1.00000000e+05,
         1.00000000e+06,   1.00000000e+07,   1.00000000e+08,
         1.00000000e+09])

x=[ i for i in range(len(y)) ]

plt.plot(x,y)
plt.scatter(x,y)
plt.title("logspace")
plt.show()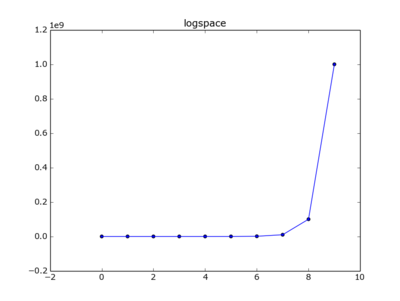
Plotting the latter on a log scale..
plt.plot(x,y)
plt.scatter(x,y)
plt.yscale('log')
plt.title("logspace on y-logscale")
plt.show()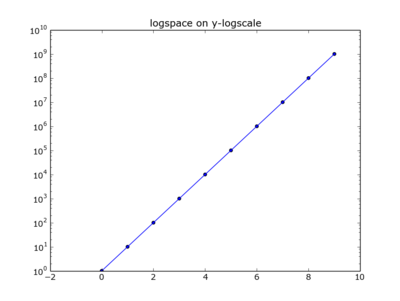
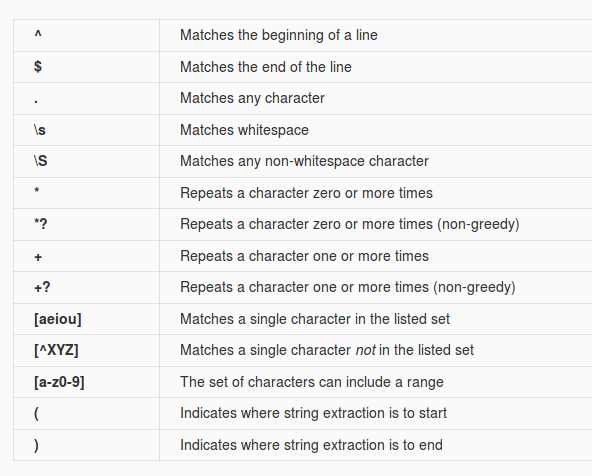
Here is Dr. Chuck's RegEx "cheat sheet". You can also download it here:
www.dr-chuck.net/pythonlearn/lectures/Py4Inf-11-Regex-Guide.doc
Here's Dr. Chucks book on learning python: www.pythonlearn.com/html-270
For more information about using regular expressions in Python, see docs.python.org/2/howto/regex.html
Regex: positive lookbehind assertion
(?<=...) Matches if the current position in the string is preceded by a match for ... that ends at the current position.
eg.
s="Yes, taters is a synonym for potaters or potatoes."

re.sub('(?<=po)taters','TATERS', s)

'Yes, taters is a synonym for poTATERS or potatoes.'
Or example from python doc:
m = re.search('(?<=abc)def', 'abcdef')
m.group(0)
'def'Fill an array with 1 particular value
Via comprehension:
z1=[0 for x in range(20)]
z1
[0, 0, 0, 0, 0, 0, 0, 0, 0, 0, 0, 0, 0, 0, 0, 0, 0, 0, 0, 0]Via built-in repeat:
z2=[0] * 20 Equal? yes.
z1==z2
TrueWhich one is faster?
timeit.timeit('z=[0 for x in range(100000)]',number=100)
0.8116392770316452
timeit.timeit('z=[0]*100000',number=100)
0.050275236018933356The built-in repeat beats comprehension hands down!
Reverse the words in a string
Tactic:
- reverse the whole string
- reverse every word on its own
Code:
s="The goal is to make a thin circle of dough, with a raised edge."
r=' '.join([ w[::-1] for w in s[::-1].split(' ') ]) The notation s[::-1] is called extended slice syntax, and should be read as [start:end:step] with the start and end left off.
Note: you also have the reversed() function, which returns an iterator:
s='circumference'
''.join(reversed(s))
'ecnerefmucric'Produce sample words
Use the sowpods file to generate a list of words that fulfills a special condition (eg length, starting letter) Use is made of the function random.sample(population, k) to take a unique sample of a larger list.
1 2 3 4 5 6 7 8 9 10 11 12 | |
Output:
['argot', 'along', 'addax', 'azans', 'aboil', 'aband']
['erred', 'ester', 'ekkas', 'entry', 'eldin', 'eruvs']
['imino', 'islet', 'inurn', 'iller', 'idiom', 'izars']
['oches', 'outer', 'odist', 'orbit', 'ofays', 'outed']
['unlaw', 'upjet', 'upend', 'urged', 'urent', 'uncus']Combinations of array elements
Suppose you want to know how many unique combinations of the elements of an array there are.
The scenic tour:
a=list('abcdefghijklmnopqrstuvwxyz')
n=len(a)
stack=[]
for i in xrange(n):
for j in xrange(i+1,n):
stack.append( (a[i],a[j]) )
print len(stack) The shortcut:
print (math.factorial(n)/2)/math.factorial(n-2)From the more general formula:
n! / r! / (n-r)! with r=2. (see itertools.combinations(iterable, r) on docs.python.org/2/library/itertools.html )
Add up from 1 to n
Add up all numbers from 1 to n.
The straight-n-simple solution:
result = 0
for i in xrange(n):
result += (i + 1)
print (result)The fast solution:
result = n * (n+1) / 2
print (result)Here's the explanation (thanks codility)
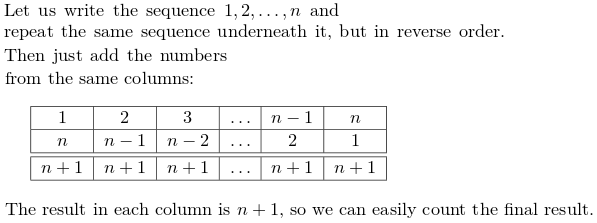
Shorties & quickies
Get an array of 10 random numbers
randrange: choose a random item from range(start, stop[)
import random
rand_arr=[ random.randrange(0,10) for i in range(10) ]Sort a list of tuples
Say you have markers that are tuples, and you want to have the marker list sorted by the first tuple element.
sorted_marker=sorted( marker, key=lambda x:x[0] ) Multi-level sort: custom compare
Use a custom compare function. The compare function receives 2 objects to be compared.
def cust_cmp(x,y):
if (x[1]==y[1]):
return cmp( x[0],y[0] )
return cmp(x[1],y[1])
names= [ ('mahalia', 'jackson'), ('moon', 'zappa'), ('janet','jackson'), ('lee','albert'), ('latoya','jackson') ]
sorted_names=sorted( names, cmp=cust_cmp)Output:
('lee', 'albert')
('janet', 'jackson')
('latoya', 'jackson')
('mahalia', 'jackson')
('moon', 'zappa')- stemmer that implements porter stemmer: stemming package
Strip HTML tags from a text.
6 7 8 9 10 11 12 13 14 15 16 17 18 19 20 21 22 23 24 25 26 27 28 29 30 31 32 33 34 35 36 | |
Output:
The Köln concert
[edit]
The concert was organized by 17-year-old
Vera Brandes, then Germany ’s youngest concert promoter.
[5] At Jarrett's request, Brandes
had selected a Bösendorfer
290 Imperial concert grand piano for the performance. As found on : stackoverflow
Strip accents from letters
See how sklearn does it, functions:
strip_accents_ascii(s)
strip_accents_unicode(s)github.com/scikit-learn/scikit-learn/blob/master/sklearn/feature_extraction/text.py
See also: stackoverflow.com/questions/517923/what-is-the-best-way-to-remove-accents-in-a-python-unicode-string
Digest of infoworld article
- Beautiful Soup: Processing parse trees -- XML, HTML, or similarly structured data
- Pillow: image processin g(following to PIL)
- Gooey: turn a console-based Python program into one that sports a platform-native GUI.
- Peewee: a tiny ORM that supports SQLite, MySQL, and PostgreSQL, with many extensions.
- Scrapy: screen scraping and Web crawling.
- Apache Libcloud: accessing multiple cloud providers through a single, consistent, and unified API.
- Pygame: a framework for creating video games in Python.
- Pathlib: handling filesystem paths in a consistent and cross-platform way, courtesy of a module that is now an integral part of Python.
- NumPy: scientific computing and mathematical work, including statistics, linear algebra, matrix math, financial operations, and tons more.
- Sh: calling any external program, in a subprocess, and returning the results to a Python program -- but with the same syntax as if the program in question were a native Python function.
Visualizing distributions of data
Visualizing distributions of data
This notebook demonstrates different approaches to graphically representing distributions of data, specifically focusing on the tools provided by the seaborn packageb
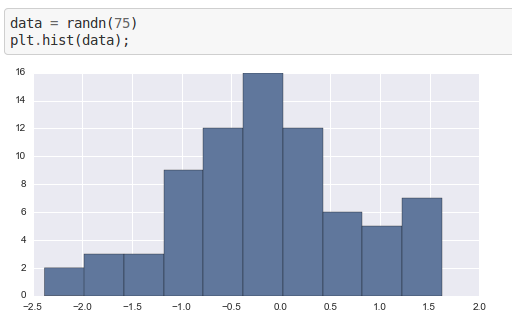
The Zen of Python
From: www.thezenofpython.com
Beautiful is better than ugly.
Explicit is better than implicit.
Simple is better than complex.
Complex is better than complicated.
Flat is better than nested.
Sparse is better than dense.
Readability counts.
Special cases aren't special enough to break the rules.
Although practicality beats purity.
Errors should never pass silently.
Unless explicitly silenced.
In the face of ambiguity, refuse the temptation to guess.
There should be one-- and preferably only one --obvious way to do it.
Although that way may not be obvious at first unless you're Dutch.
Now is better than never.
Although never is often better than *right* now.
If the implementation is hard to explain, it's a bad idea.
If the implementation is easy to explain, it may be a good idea.
Namespaces are one honking great idea -- let's do more of those!Archive files into a zipfile
A cronjob runs every 10 minutes produces these JSON files:
6752 Sep 10 08:30 orderbook-kraken-20150910-083003.json
6682 Sep 10 08:40 orderbook-kraken-20150910-084004.json
6717 Sep 10 08:50 orderbook-kraken-20150910-085004.json
6717 Sep 10 09:00 orderbook-kraken-20150910-090003.json
6682 Sep 10 09:10 orderbook-kraken-20150910-091003.json
6717 Sep 10 09:20 orderbook-kraken-20150910-092002.json
6717 Sep 10 09:30 orderbook-kraken-20150910-093003.json
6682 Sep 10 09:40 orderbook-kraken-20150910-094003.json
6682 Sep 10 09:50 orderbook-kraken-20150910-095003.json
6752 Sep 10 10:00 orderbook-kraken-20150910-100004.json
6788 Sep 10 10:10 orderbook-kraken-20150910-101003.json
6787 Sep 10 10:20 orderbook-kraken-20150910-102004.json
6823 Sep 10 10:30 orderbook-kraken-20150910-103004.json
6752 Sep 10 10:40 orderbook-kraken-20150910-104004.jsonAnother cronjob, run every morning, zips all the files of one day together into a zipfile, turning above files into:
20150910-orderbook-kraken.zip
20150911-orderbook-kraken.zip
20150912-orderbook-kraken.zip
.. Here's the code of the archiver (ie the 2nd cronjob) :
import os,re,sys
import zipfile
from datetime import datetime
# get a date from the filename. Assumptions:
# - format = YYYYMMDD
# - date is in this millenium (ie starts with 2)
# - first number in the filename is the date
def get_date(fn):
rv=re.sub(r'(^.[^0-9]*)(2[0-9]{7})(.*)', r'\2', fn)
return rv
# first of all set the working directory
wd=sys.argv[1]
if (len(wd)==0):
print "Need a working directory"
sys.exit(0)
os.chdir(wd)
# find the oldest date-pattern in the json files
ds=set()
for filename in os.listdir("."):
if filename.endswith(".json"):
ds.add(get_date(filename))
#print "{}->{}".format(filename,dt)
# exclude today's pattern (because today may not be complete):
today=datetime.now().strftime("%Y%m%d")
ds.remove(today)
l=sorted(list(ds))
#print l
if (len(l)==0):
#print "Nothing to do!"
sys.exit(0)
# datepattern selected
datepattern=l[0]
# decide on which files go into the archive
file_ls=[]
for filename in os.listdir("."):
if filename.endswith(".json") and filename.find(datepattern)>-1:
file_ls.append(filename)
#print "{}->{}".format(filename,dt)
# filename of archive: get the first file, drop the .json extension, and remove all numbers, add the datepattern
file_ls=sorted(file_ls)
stem=re.sub('--*','-', re.sub( '[0-9]','', re.sub('.json$','',file_ls[0]) ))
zipfilename=re.sub('-\.','.', '{}-{}.zip'.format(datepattern,stem))
#print "Zipping up all {} files to {}".format(datepattern,zipfilename)
zfile=zipfile.ZipFile(zipfilename,"w")
for fn in file_ls:
#print "Adding to zip: {} ".format(fn)
zfile.write(fn)
#print "Deleting file: {} ".format(fn)
os.remove(fn)
zfile.close()Note: if you have a backlog of multiple days, you have to run the script multiple times!