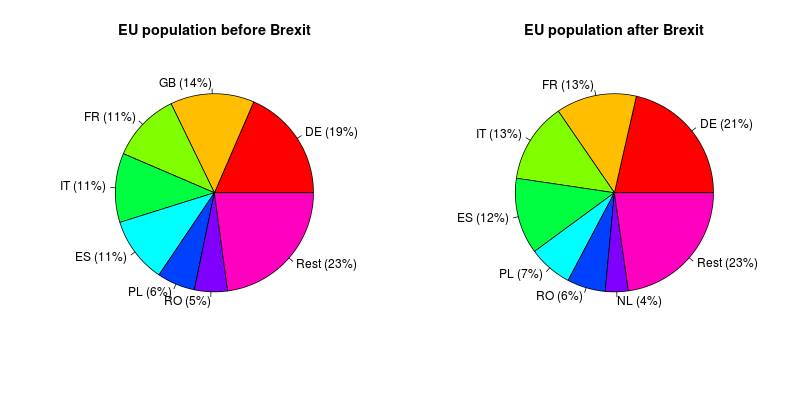
1
2
3
4
5
6
7
8
9
10
11
12
13
14
15
16
17
18
19
20
21
22
23
24
25
26
27
28
29
30
31
32
33
34
35
36
37
38
39
40
41
42
43
44
45
46
47
48
49
50
51
52
53
54
55
56
57
58
59
60
61
62
63
64
65
66
67
68
69
70
71
72
73
74
75
76
77
78
79
80
81
82
83
84
85
86
87
88
89
90
91
92
93
94
95
96
97
98
99
100
101
102
103
104
105
106
107
108
109
110
111
112
113
114
115
116
117
118
119
120
| ##================================================================================
##== $sqlquery_java =============================================================
" select country, sum(population) as sum_pop "+
" from t_city "+
" where country in ('AT', 'BE', 'BG', 'CY', 'CZ', 'DE', 'DK', 'EE', 'ES', 'FI', 'FR',"+
" 'GB', 'GR', 'HR', 'HU', 'IE', 'IT', 'LT', 'LU', 'LV', 'MT', 'NL',"+
" 'PL', 'PT', 'RO', 'SE', 'SI', 'SK', 'AN')"+
" group by country"+
" order by 2 desc;"
##================================================================================
##== $print_result_java =========================================================
System.out.printf("%s\t%d\n", rs.getString(1), rs.getInt(2));
##================================================================================
##== plot.R ======================================================================
topn=7 # experiment: eg. change to top-10 or top-5
df<-read.table('result.csv',sep="\t",header=F)
colnames(df)=c("country", "population")
pd=rbind( df[1:topn,], data.frame(country="Rest",
population=sum(df[(topn+1):nrow(df),"population"])) )
pct <- round(pd$population/sum(pd$population)*100)
pd$label=paste(pd$country," (",pct,"%)",sep="")
#x11(width=800, height=300)
png('pie.png',width=800, height=400)
par(mfrow = c(1, 2))
pie(pd$population,labels=pd$label,main="EU population before Brexit",
col=rainbow(nrow(pd)))
# drop GB
df<-df[ df$country!='GB',]
pd=rbind( df[1:topn,], data.frame(country="Rest",
population=sum(df[(topn+1):nrow(df),"population"])) )
pct <- round(pd$population/sum(pd$population)*100)
pd$label=paste(pd$country," (",pct,"%)",sep="")
pie(pd$population,labels=pd$label,main="EU population after Brexit",
col=rainbow(nrow(pd)))
dev.off()
##================================================================================
##== dirty/query/Query.java ======================================================
package query;
import java.sql.Connection;
import java.sql.DriverManager;
import java.sql.ResultSet;
import java.sql.Statement;
public class Query {
public static void main( String args[]) {
Connection con = null;
Statement stmt = null;
try {
Class.forName("org.postgresql.Driver");
con = DriverManager.getConnection("jdbc:postgresql://172.16.1.43:5432/dmn",
"dmn", "dmn");
con.setAutoCommit(false);
stmt = con.createStatement();
ResultSet rs = stmt.executeQuery(
[[$sqlquery_java]]
);
while ( rs.next() ) {
[[$print_result_java]]
}
rs.close();
stmt.close();
con.close();
} catch ( Exception e ) {
System.err.println( e.getClass().getName()+": "+ e.getMessage() );
System.exit(0);
}
}
}
##================================================================================
##== aardvark.sh =================================================================
#!/bin/bash
export DB_RESULT="result.csv"
# --------------------------------------------------------------
# Part 1: compile the java file, and run it (conditionally)
export POSTGRESJDBC="/opt/jdbc/postgres/postgresql-9.4.1208.jar"
S="query/Query.java"
T=${S%.java}.class
E=${S%.java}
# compile: but only if java code is younger then class
S_AGE=`stat -c %Y "dirty/"$S`
T_AGE=`stat -c %Y "dirty"/$T`
if [ -z $T_AGE ] || [ $T_AGE -le $S_AGE ]
then
echo "## Compiling"
(cd dirty; javac $S)
fi
# check if class file was produced
if [ ! -e "dirty/"$T ]
then
echo "## '$T' doesn't exist, can't run it."
exit 1
fi
# execute
echo "Fetching data from DB"
java -cp $POSTGRESJDBC:dirty $E $* > $DB_RESULT
# --------------------------------------------------------------
# Part 2: kick off R
echo "Plotting"
R_EXE="/usr/bin/R --slave --vanilla --quiet"
$R_EXE -f ./plot.R
|
