Simple Sales Prediction
Pages:
01_intro
02_conversion
03_averages
04_difference
05_product
06_sum
07_the_omegas
08_coefficients
09_prediction
10_visualized
11_reduction
12_to_wide
99_appendix
01_intro
02_conversion
03_averages
04_difference
05_product
06_sum
07_the_omegas
08_coefficients
09_prediction
10_visualized
11_reduction
12_to_wide
99_appendix
One Page
10_visualized
20160616
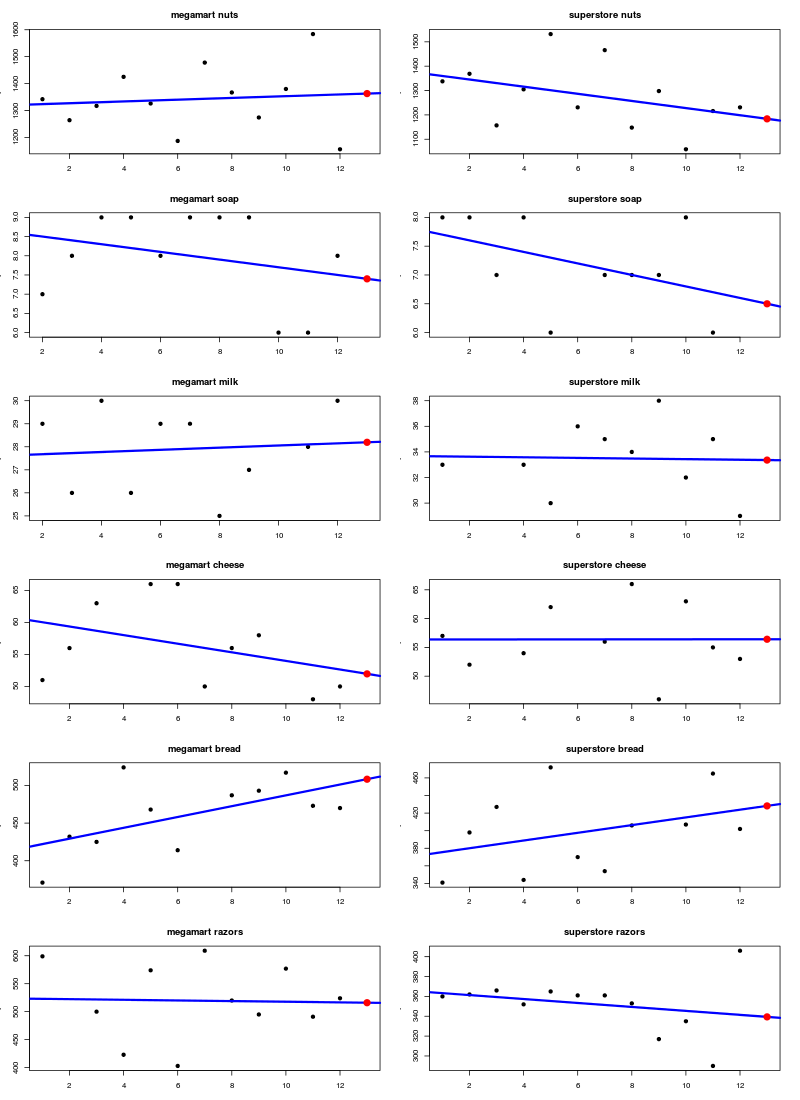
Visualized : plot
- The black dots represent the monthly sales figures.
- The blue line is the line fitted by R's lm() function through the sales dots.
- The red dot is the predicted sale for month 13.
- In each case the red dot lies on the blue line, which proves the correctness.
The R code
1 2 3 4 5 6 7 8 9 10 11 12 13 14 15 16 17 18 19 20 21 22 23 24 25 | |