x_v= [300.,245.,170.,261.,240.,200.,217.,55.,110.,256.,90.,245.,200.,
      139.,260.,300.,195.,153.,138.,185.,170.,66.,100.,160.,110.,197.,
      135.,214.,259.,196.,216.,161.,100.,130.,250.,120.,230.,122.,120.,
      260.,175.,200.,100.]

y_v= [625.,335.,479.,500.,490.,325.,495.,172.,325.,395.,225.,630.,325.,
      425.,425.,625.,520.,248.,258.,349.,269.,245.,249.,275.,299.,525.,
      560.,345.,630.,399.,445.,420.,240.,395.,550.,225.,635.,320.,275.,
395.,420.,430.,239.]Simple Linear Regression
Pages:
01_intro
02_formulas
03_data
04_implementation
05_gradient_descent
99_formulas
99_nitty_gritty
01_intro
02_formulas
03_data
04_implementation
05_gradient_descent
99_formulas
99_nitty_gritty
One Page
03_data
20160102
House price data
The data used is this article is the following, actual house price data sampled on 2016-01-02. The x vector has the surface area in square meters, and the y vector contains the corresponding price in kilo-EURO's.
x_v= c(300,245,170,261,240,200,217,55,110,256,90,245,200,139,260,300,
      195,153,138,185,170,66,100,160,110,197,135,214,259,196,216,161,
      100,130,250,120,230,122,120,260,175,200,100)

y_v= c(625,335,479,500,490,325,495,172,325,395,225,630,325,425,425,625,
      520,248,258,349,269,245,249,275,299,525,560,345,630,399,445,420,
      240,395,550,225,635,320,275,395,420,430,239)
Scatterplot
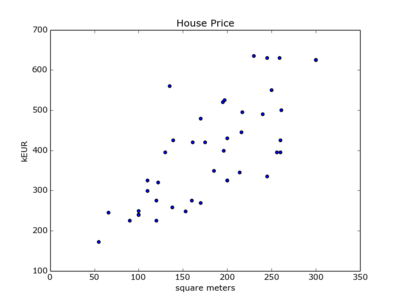
    import matplotlib.pyplot as plt

    plt.scatter(x_v, y_v)
    plt.ylabel('kEUR')
    plt.xlabel('square meters')
    plt.title('House Price')
    plt.show()